
Popular
Most Recent
Loading Posts...

Best Practice
Influence That Drives Outcomes In AI Search
February 3, 2026
If you still think influencer marketing is a “nice to have,” AI-powered discovery is about to make you rethink your priorities.
Buyers are not just Googling anymore. They are asking...

Influencer ListsMarketing
26 Marketing Leaders Calling the Shots in 2026
December 16, 2025
Great marketing leadership is not about playing it safe. It is about making confident decisions, questioning outdated assumptions, and being willing to do things differently when the old playbook no...

Best PracticeInfluencer ActivationMarketing
B2B Brands Are Getting Bolder: Why Humor, Personality, & Hot Takes Are Winning
July 8, 2025
Serious question: When did “B2B” become synonymous with “boring”? Or, if that’s too harsh for you, how about “safe”, “expected”, or “standard”?
In our industry, it can be...

Best PracticeMarketing
Beyond SEO: Why Influencers Are Your Edge in the Age of AI Search
June 30, 2025
For years, B2B marketers have been laser-focused on one goal: showing up on Google’s first page.
But the way we search is changing, and it is changing fast. Traditional search engines are...
Best PracticeInfluencer Activation
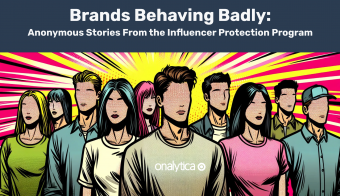
Brands Behaving Badly: Anonymous Stories From the Influencer Protection Program
June 24, 2025
Influencer marketing can be incredibly effective when it’s done right. But when it’s done wrong? That’s a whole different story.
If you’ve been here before, you know we spend a lot of time...

Best PracticeMarketing
The Future of B2B Marketing Is on TikTok: 10 AI Creators to Watch
June 17, 2025
If we say “TikTok,” what pops into your head? Probably dance trends, GRWM vids, and someone shouting “run, don’t walk!” to the newest brunch spot in NYC.
And sure — TikTok did start...
Influencer ListsTech
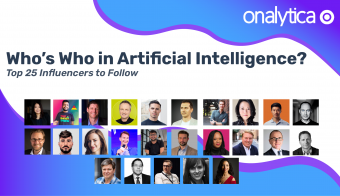
Who’s Who in AI? Top 25 Influencers to Follow in 2024
September 18, 2024
As the conversation around AI continues to evolve, the team at Onalytica has been listening closely to our customers and the broader market. The influence of AI in driving innovation, efficiency, and...

Best PracticeEvents
Martechopia London: Your Guide to Must-Attend Sessions
February 28, 2024
B2B marketing is undergoing a seismic shift due to the rapid evolution of artificial intelligence. It's an exciting time, but it's also easy to get lost in the hype. How do you separate the...
Best PracticeEvents
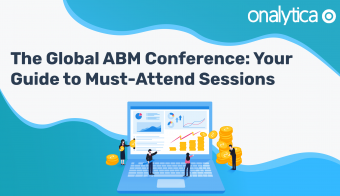
The Global ABM Conference: Your Guide to Must-Attend Sessions
October 26, 2023
Marketing leaders from around the globe are flocking to London next week for The Global ABM Conference by B2B Marketing. With Account-Based Marketing (ABM) having such a deep focus on building...
Best Practice
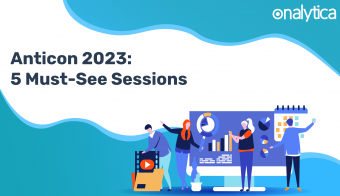
Anticon 2023 Preview: Sessions We Won’t Miss At The Tech-Focused Anti-Conference
October 18, 2023
This week MarTech, SalesTech, and AdTech leaders are meeting in London for a global anti-conference experience. Anticon 2023 is bringing together brands, agencies, and media companies together to...

Best Practice
Reimagining the Relationship Between Marketing and our Buyers
July 10, 2023
Reimagining the Relationship Between Marketing & Buyers #B2BIgniteLondon
Last week, Antonia Wade, CMO, PwC, delivered the opening keynote at B2B Ignite London that left us with plenty to...

Best Practice
Sessions You Can’t Afford To Miss at B2B Ignite London 2023
June 28, 2023
This week, Ignite, will bring together the entire B2B Marketing industry at their 2023 London event and our team are thrilled to be attending. With 100s of leading companies in attendance including...

Influencer ListsTech
Who’s Who in 5G? Top 50 Influencers to Follow
June 22, 2023
The world of technology is constantly evolving, and every leap forward brings new possibilities that shape our lives. One such ground-breaking advancement is the advent of 5G, the fifth generation of...

Best PracticeB2BInfluencer DiscoveryMarketing
Influencer Selection Made Easy: Introducing Media Monitoring
May 31, 2023
A pivotal moment in every customer’s Influencer Marketing journey is finding the right influencer to collaborate with. Discovering new creators on social media has never been easier (only 9% of...

Influencer ListsTech
Who’s Who in Sustainability? Top 50 Influencers to Follow
May 23, 2023
In recent years, sustainability has emerged as a crucial concern for businesses across the globe. With increasing awareness about environmental and social issues, organizations are recognizing the...

Best PracticeMarketing Stategy
Event Recap: The B2B Influencer Marketing Summit
May 2, 2023
When you’re able to gather with your B2B Influencer Marketing squad, amazing things can happen. Just last month we hosted the B2B Influencer Marketing Summit in San Francisco with the help of...

Influencer ListsTech
Who’s Who in Cloud? Top 50 Influencers to Follow
April 25, 2023
Cloud computing is a technology that has revolutionized the way we store, access, and process data. It allows businesses and individuals to access a vast array of computing resources - including...

Influencer ListsTech
Who’s Who in Industry 4.0? Top 50 Influencers to Follow
March 21, 2023
Whenever we talk about Industry 4.0 – we all need to talking about the same thing. Industry 4.0 is the moniker given to the Fourth Industrial Revolution. And as its name implies, it is a revolution...

Best PracticeTech
IWD 2023: What #EmbraceEquity Means for the Women at Onalytica
March 8, 2023
For International Women’s Day, we rallied together some of the wonderful women at Onalytica, to learn about their experiences of being a woman in tech, and their views on what changes need to...

Best PracticeEmployee Advocacy
10 Tips for Increasing Your Influence
February 27, 2023
[et_pb_section][et_pb_row][et_pb_column type="4_4"][et_pb_text]The by-product of more brands doing B2B Influencer Marketing is that more individuals are earning themselves a living by becoming...

Influencer ListsTech
Who’s Who in ESG? Top 50 Influencers to Follow
February 21, 2023
If you polled corporate boards, financial services firms, and governments about ESG, you might come away with as many definitions as respondents. However, at a base level, the acronym "ESG" refers to...

Best PracticeMarketing
Onalytica Launches YouTube Search!
February 15, 2023
With 2023 well underway, we’d like to give you all an update on recent changes to the Onalytica platform, as well as a future-gaze into the new functionalities that users can expect in the first...

Best PracticeMarketingMarketing Stategy
2023 Marketing Budgets: How to do More with Less?
February 2, 2023
Times are tough for marketers in 2023. Budget cuts and freezes are a widespread problem and 33% of marketers say that their lack of budget is hindering their ability to create content. While budgets...

Influencer ListsTech
Who’s Who in Future of Work? Top 50 Influencers to Follow
January 24, 2023
By definition, Future of Work is a projection of how work, workers and the workplace will continue to evolve. While a lot of the focus has been placed on developing technology (like AI, for example),...
Best PracticeB2BMarketing Stategy
Why B2B Brands Should do Influencer Marketing
January 11, 2023
2023 will see budget squeezes in all business verticals and B2B marketers will too have to adapt their strategy to make the most of what they have. Influencer marketing can bring immense value to...

Best PracticeB2BMarketingMarketing StategyTech
What B2B Marketers Predict for Influencer Marketing in 2023
December 14, 2022
While 2022 was a busy year for the Social Media & B2B Influencer Marketing space, there has been a lot of uncertainty moving into the next year as a global recession is looming and social media...

InterviewsTech
Interview with Eduardo Meza-Etienne
December 11, 2022
Eduardo Meza-Etienne is a digital accessibility expert, diversity and inclusion, and business strategist. With a background in economics and international trade, his career expands to other areas...

Best Practice
Killer Collaboration Examples that Prove the Value of Influencer Marketing
December 7, 2022
2022 has been a year of great content, and we loved watching some incredible and beneficial collaborations throughout the year. With the social media landscape continuing to evolve, marketers are...

Best PracticeInfluencer ActivationMarketingMeasuring Success
Influencer Knowledge Share from our B2B Social Trailblazers Summit
November 30, 2022
At our recent B2B Social Trailblazers Summit in partnership with Immediate Future, we hosted an Influencer Knowledge Share session, in which some of the key influencers in attendance shared their...
Best PracticeInfluencer ActivationMarketingMarketing Stategy
2022 State of B2B Social Media Marketing Industry
November 29, 2022
We are SO excited to announce the launch of our 2022 State of B2B Social Media Marketing Industry report, in partnership with Immediate Future! The social media landscape continues to evolve, and in...
Best PracticeMarketing Stategy
Key Takeaways From our B2B Social Trailblazers Summit
November 22, 2022
On November 3rd, together with Immediate Future, we hosted an in-person B2B Social Trailblazers Summit in London, to help B2B Marketers remain on the cutting edge of social media, and equip them with...

InterviewsFinanceTech
An Interview with Sramana Mitra
November 18, 2022
Sramana Mitra is Founder and CEO of One Million by One Million (1Mby1M), a global virtual accelerator that aims to help one million entrepreneurs globally to reach $1 million in revenue and beyond....

InterviewsFinanceTech
An Interview with Richard Turin
November 16, 2022
Rich Turrin is the international best-selling author of “Cashless - China’s Digital Currency Revolution” and “Innovation Lab Excellence.” He is Onalytica’s number 4 rated global fintech...

InterviewsFinanceTech
An Interview with John Kiff
November 1, 2022
From 2005 to 2021, John was a Senior Financial Sector Expert at the International Monetary Fund (IMF). Prior to that, he was at the Bank of Canada for 25 years, where he spent most of his time...

InterviewsFinanceTech
An Interview with Brice Groche
October 31, 2022
I'm a Banking and Fintech seasoned professional with 17 years of experience. Currently working as partnership director in a software-as-a-service Fintech: Skaleet, a Core Banking Platform next-gen...

InterviewsFinanceTech
An Interview with Dharmesh Mistry
October 31, 2022
Dharmesh has 30 years experience in launching ground breaking and innovative solutions for banks such as the first roll out of windows apps across a branch network (1990), vision of single customer...

Influencer ListsTech
Who’s Who in Artificial Intelligence? Top 50 Influencers to Follow
October 25, 2022
Artificial Intelligence is a technology that simulates human intelligence processes by machines and computer systems. There's a plethora of different Artificial Intelligence applications including...

InterviewsFinanceTech
An Interview with Ignacio Esteban Carballo
October 24, 2022
Recognized LAC Fintech; Financial Inclusion thought leader, author and public speaker.
Author of several academic research articles, lecturer and international columnist.
Over fifteen years working...

InterviewsTech
An Interview with Jeremy Ward
October 20, 2022
With over 30+years in IT, Jez Heads up the Advisory function at Cloudreach and is also an Executive Advisor dedicated to accelerating clients’ business value with Cloud.
He advises and helps CxOs...

InterviewsFinanceTech
An Interview with Susanne Chishti
September 27, 2022
Susanne Chishti is the award-winning CEO of FINTECH Circle and a FTSE Board Member. As Investor and Editor of The FINTECH Book Series she lives with her family in London and is a Non-Executive...

Best PracticeInfluencer ActivationMarketingMeasuring Success
Insider Tips for Creating Your Influencer Rate Card
September 21, 2022
As the relationships between influential experts and brands continue to mature, it raises questions about how much these partnerships are worth. Recent studies have found that the B2B Influencer...

Influencer ListsFinance
Who’s Who in Fintech? Top 50 Influencers to Follow
September 20, 2022
Fintech, or Financial Technology, is a blanket term for technology that augments, streamlines and digitizes traditional financial services. It includes an extensive number of services including (but...

Best Practice
We’re changing how we do our influencer lists and here’s why
September 14, 2022
Onalytica have been creating influencer lists for 10+ years, in which time we’ve published 187 influencer lists spanning across topics such as AI, IOT, Future of Work, 5G and Fintech – just to...

InterviewsTech
An Interview with Mark van Rijmenam
August 23, 2022
Dr Mark van Rijmenam is The Digital Speaker. He is a future tech strategist who thinks about how technology changes organisations, society and the metaverse. Dr Mark van Rijmenam is an international...

InterviewsTech
An Interview with Rene Schulte
August 23, 2022
René Schulte is Director of Global Innovation at Valorem Reply and leader of the Spatial Computing and Metaverse practice at Reply working with teams across the globe on emerging technologies like...

Influencer ListsTech
Metaverse: 32 Content Creators & Thought Leaders to Follow
August 16, 2022
Recently we hosted an Onalytica Experts LinkedIn Live with Alex Rühl, Jeremy Dalton & Jack Morel-Paulo to discuss the ever present topic in most conversations about the future & technology - The...

InterviewsTech
An Interview with Romeo Giuliano
August 9, 2022
Romeo Giuliano received a Ph.D. in Telecommunications and Microelectronic Engineering in 2004, from University of Rome Tor Vergata, Italy.
He is currently an Associate Professor at Guglielmo Marconi...

InterviewsTech
An Interview with Matt Hatton
August 9, 2022
Matt is Founding Partner at Transforma Insights. He is a well-respected commentator and technology industry expert with over 20 years of experience at the cutting edge of technology research and...

InterviewsTech
An Interview with Noah Kravitz
August 4, 2022
Noah Kravitz is a content creator and technologist with expertise in AI and related technologies, consumer electronics, and B2B technology (CRM/SaaS/Salesforce and CyberSecurity). He used to review...

InterviewsTech
An Interview with Will Townsend
July 29, 2022
Will Townsend is a frequent Forbes contributor and advises some of the largest networking and telecommunications companies in the world. His more than thirty years of experience spans tenures spent...

InterviewsTech
An Interview with Carrie Charles
July 28, 2022
Carrie Charles is the CEO of Broadstaff, the industry leader in providing direct and contract-to-hire placement services nationwide within technology and telecommunications headquartered in Tampa,...

InterviewsTech
An Interview with Tom White
July 26, 2022
Tom White is a seasoned IoT, video and Technology expert, with over 15 years of experience in the industry. Tom has founded multiple global businesses including expert IoT and Technology Talent...

InterviewsTech
An Interview with Mohamed Idrissi
July 26, 2022
Mohamed Idrissi is a passionate 5G expert, 5G Trainer, and the CTO of 5GWorldPro, a telecommunication company that has independent, and deep knowledge of multi-vendor implementations.
Mohamed is...
Influencer ListsTech
Diversity, Equity and Inclusion: A Study into Tech Brands’ Perception & Impact
July 21, 2022
Diversity and inclusion initiatives are becoming more widespread across brands and, in the best cases, are being acted upon properly. Unfortunately, this is not the case worldwide,...

InterviewsTech
An Interview with Anshel Sag
July 20, 2022
Anshel Sag is Principal Analyst at Moor Insights & Strategy where he covers 5G, XR, PCs, Smartphones, Wearables, and Gaming. He has been an analyst at the firm for over 7 years.

InterviewsTech
An Interview with Marcin Dryjanski
July 20, 2022
Marcin Dryjanski received his Ph.D. (with distinction) from the Poznan University of Technology in September 2019. Currently, he serves as CEO and principal consultant at Rimedo Labs, a spin-off of...
InterviewsTech
An Interview with Jennifer McClure
July 20, 2022
Jennifer McClure is a keynote speaker and high-performance coach who helps leaders to leverage their influence, increase their impact, and accelerate results.
Frequently recognized as a global...

InterviewsTech
An Interview with Sanjay Kumar
July 18, 2022
Sanjay Kumar is a distinguished Entrepreneur and Senior Telecom & Cloud (AWS) Training Professional with 20+ years of experience in Telecom Training, Operations & Maintenance, Projects, and Training...

InterviewsTech
An Interview with Chelsea Larson-Andrews
July 18, 2022
Tech influencer marketing is my jam.
I’m a tech enthusiast and entrepreneur, and in 2016 I merged these two things to co-found a marketing agency, known as TechMode.io, that works exclusively with...

InterviewsTech
An Interview with Rory Preddy
July 1, 2022
Rory Preddy works in the Developer Relations team at Microsoft as a Principal Cloud Advocate. Cloud Advocates use their deep research skills to help professional cloud developers discover and...

InterviewsTech
An Interview with Robbrecht van Amerongen
July 1, 2022
I try to create the type of world I want to live in. By doing this I help and challenge others to take the next step, and grow. My life motto is derived from the quote of Pippi Longstocking: “I...

InterviewsTech
An Interview with Shyam Nath
June 28, 2022
Shyam V Nath is the author of three books on topics related to Digital Twins, Digital Transformation, and Industrial IoT. Shyam has worked in the industry for over 30 years with companies like...

InterviewsTech
An Interview with Alfian Manullang
June 27, 2022
Alfian Manullang currently holds a Senior Leader Position in Telkomsel IoT Organization. He is now Vice President of Internet of Things at Telkomsel. Telkomsel is part of PT Telekomunikasi Indonesia,...

InterviewsTech
An Interview with Joseph A. di Paolantonio
June 23, 2022
Joseph is an independent researcher, influencer, and consultant with over 20 years of experience in the Internet of Things. He built upon his experience with complex systems in renewable energy,...
InterviewsTech
An Interview with Anne Høyer
June 22, 2022
Anne Høyer is an expert in data-driven innovation, who started her technology career at SAP and quickly progressed to a global role in the industry. Having held several roles within IoT as; Head of...

Influencer ListsTech
Who’s Who in 5G?
June 22, 2022
5G is the fifth generation of cellular networks which is up to 100 times faster than 4G.
5G enables a new kind of network that connects virtually everyone and everything together...

InterviewsTech
An Interview with Rich Nass
June 21, 2022
Richard Nass’ key responsibilities include setting the direction for all aspects of OpenSystems Media’s Embedded and IoT portfolios, including digital, print, and live events. Previously, Nass...
InterviewsTech
An Interview with Sarah Lean
June 16, 2022
With a diverse career that spans over eighteen years, Sarah has been a part of every aspect of the IT world. Sarah is a Microsoft Certified Trainer (MCT), Microsoft Most Valuable Professional (MVP),...

InterviewsTech
An Interview with Nedzad Piric
June 6, 2022
Nedzad Piric has 25+ years of experience in the fields of Digitalization, Digital Transformation, Smart Cities, Digital Marketing, Education, Human Resources, Business Development, Asset Management,...

Best PracticeEventsMarketing
12 Must-See Sessions at #B2BIgniteUSA
May 27, 2022
Temperatures have risen, flowers have begun to bloom and there is a shift in the air. That can only mean one thing: conference season has sprung.
Like many of you, it feels like decades since I...

InterviewsTech
An Interview with Chris Adkin
May 27, 2022
Chris has worked in the IT industry for over twenty years, in roles ranging from developer, to an architect to DBA, Chris's primary area of interest is in stateful workloads and databases running on...

Best PracticeMarketing
New Onalytica Feature: Campaigns
May 26, 2022
The Campaigns feature in Onalytica programs is one of our most recent additions to the platform. We created Campaigns in response to a problem we’ve seen crop up regularly for clients – the lack...
Best PracticeMarketing
Amardeep Sidhu on the Evolution of Influencer Marketing in B2B
May 25, 2022
We wanted to shine a light on a few of our team members and get their thoughts on the influencer marketing industry and how they think it’s changed over the past few years. Amardeep Sidhu started...

InterviewsTech
An Interview with Michael Mattsson
May 25, 2022
Michael Mattsson is a Tech Marketing Engineer and Master Technologist at Hewlett Packard Enterprise with over two decades in the storage industry carrying various roles ranging from operation,...

InterviewsTech
An Interview with Stephen Harwood
May 24, 2022
Dr. Stephen Harwood has had many lives including that of geophysicist, writer, educator, change agent, entrepreneur, and director. Most recently he founded TechnoForeSight to promote and advise upon...

InterviewsTech
An Interview with Marius Sandbu
May 23, 2022
Marius Sandbu is a Cloud expert who has been focusing on building company-wide competency/expertise on Public Cloud and looking over the technical initiatives on Public Cloud including building...

InterviewsTech
An Interview with Daniele Polencic
May 20, 2022
Daniel Polencic is a certified Kubernetes Administrator. He teaches containers and Kubernetes at Learnk8s.
Daniel has recently featured in Onalytica's Who's Who in Cloud report.

InterviewsTech
An Interview with Ron Westfall
May 19, 2022
Ron Westfall is an experienced research expert and analyst with over 20 years of experience in the digital and IT transformation markets.
Ron has recently featured in Onalytica's Who's Who in Cloud...

InterviewsTech
An Interview with Jack Gold
May 18, 2022
Jack Gold has more than 45 years of experience in the computer and electronics industries working at both large firms and startups, has been an industry analyst for more than 25 years, and is the...

Influencer ListsTech
Who’s Who in IoT?
May 18, 2022
Over the past couple of years, IoT has become one of the most important emerging technologies in the 21st century. IoT connects devices to the internet using sensors and software to...
InterviewsMarketing
Alex Edwards on the Evolution of Influencer Marketing in B2B
May 17, 2022
We wanted to shine a light on a few of our team members and get their thoughts on the influencer marketing industry and how they think it's changed over the past few years. First up, Alex Edwards!...

InterviewsTech
An Interview with Elias Khnaser
May 17, 2022
Elias Khnaser is an internationally recognized thought leader in the areas of cloud computing and digital disruption. Until recently, Elias was a research vice president at Gartner, where he spent...

InterviewsTech
An Interview with Mark Albertson
May 16, 2022
Mark Alberson is a communications professional with over 30 years of experience working in or covering the technology field. Built and managed communications, government relations, and...

InterviewsTech
An Interview with Lynn Langit
May 13, 2022
Lynn Langet is a Cloud Architect working with remote dev teams worldwide to build cloud solutions.
She is the author of 25 LinkedIn Learning Cloud/Data courses with over 4 million student...

Best PracticeMarketingMarketing Stategy
The Power of Storytelling in B2B Marketing
May 12, 2022
Stories are everywhere. They make us feel, they help us learn, and they intrigue us to the point of staying up far too late just to finish the final chapter of a good book. The most powerful...

InterviewsTech
An Interview with Mike Pfeiffer
May 9, 2022
Mike Pfeiffer is a Twenty-year IT industry veteran who most recently founded CloudSkills.io (acquired by INE) and worked as an engineer and cloud architect for Microsoft and Amazon Web Services.
He's...

InterviewsTech
An Interview with Lee Atchison
May 6, 2022
Lee Atchison is a recognized thought leader in cloud computing and application modernization. With more than three decades of experience in product development, architecting, scaling, and...

InterviewsTech
An Interview with Steven Dickens
May 5, 2022
Steven Dickens is VP of Business Development and Senior Analyst at Futurum Research. Operating at the crossroads of technology and disruption, Steven engages the world’s largest technology brands...

InterviewsTech
An Interview with Randall Hunt
May 4, 2022
Randall Hunt, VP of Cloud Strategy and Solutions at Caylent, is a technology leader, investor, and hands-on keyboard coder based in Los Angeles, CA. Previously, Randall led software and developer...
Best PracticeInfluencer ActivationMarketingMeasuring Success
How influencers can get more work from brands
May 4, 2022
As an influencer, the brands you work with are your customers, so it makes sense to think about ways in which you can effectively meet their needs. By understanding brands’ needs, you are better...

InterviewsTech
An Interview with Tyler Cohen Wood
April 29, 2022
Tyler Cohen has worked at the U.S. Defense Intelligence Agency (DIA) under the DoD, serving as a Senior Intelligence Officer, Deputy Cyber Division Chief of the Special Communications Division, and...

InterviewsTech
An Interview with Tom Cheesewright
April 28, 2022
Tom Cheesewright is the Applied Futurist, helping people and organisations around the world to see the future more clearly, share their vision, and respond with innovation. Tom helps clients and...

Influencer ListsTech
Who’s Who in Cloud?
April 20, 2022
Cloud computing delivers computing services (servers, storage, databases, networking, software, analytics and intelligence) over the internet (the cloud) to offer flexible resources and...

InterviewsTech
An Interview with Rainier Varilla
April 7, 2022
Rainier Varilla is a passionate technical sales leader with over 30 years of experience leading, designing, and developing sound customer solutions. He has delivered C-Level business and technical...

InterviewsTech
An Interview with Antonio Grasso
April 6, 2022
Founder and CEO of Italian startup Digital Business Innovation Srl, Antonio is regarded as one of the top digital transformation influencers and researchers on artificial intelligence, cybersecurity,...
InterviewsTech
An Interview with Rick Huckstep
April 5, 2022
My entire career has been built on providing technology solutions to business problems. For the past decade, I have worked with technology founders and entrepreneurs, advising them on strategies to...

InterviewsTech
An Interview with Kayne McGladrey
April 1, 2022
Kayne McGladrey, CISSP is the cybersecurity strategist for Ascent Solutions and a senior member of the IEEE. He has over two decades of experience in cybersecurity and has served as CISO at a defense...

InterviewsTech
An Interview with Matthew Fisher
March 30, 2022
Matt Fisher is the General Counsel for Carium, a virtual care platform that drives ongoing engagement between patients and care teams. He helps guide his company and others through the healthcare...

InterviewsEmployee AdvocacyTech
Alicia Russell: Onalytica’s Women in the Spotlight
March 28, 2022
In the light of International Women's Day we have decided to take the opportunity to champion some of the amazing women here at Onalytica throughout the month of March. We’ve carefully selected...
InterviewsTech
An Interview with Jeremy Scrivens
March 28, 2022
Jeremy is an Appreciative Futurist & Collaboration & Innovation Catalyst. He is a Director of The Emotional Economy at Work and a global thought leader and consultant on building collaboration in a...

InterviewsTech
An Interview with Emily Klein
March 25, 2022
Emily Klein has extensive leadership, management, and consultative sales experience in enterprise and SMB organizations and creates successful client partnerships and business development strategies...

InterviewsTech
An Interview with Andrew Spence
March 24, 2022
Andrew Spence is a Workforce Futurist, Global Speaker, Writer and Work Technology Board Advisor
He is also an experienced independent management consultant specialising in building people-centric...
Influencer ListsTech
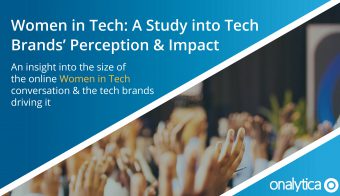
Women in Tech: A Study into Tech Brands’ Perception & Impact
March 24, 2022
The world runs on technology. From the moment you wake up, to the time you go to bed, you’re interacting with technology, and unless you decide to live off-grid in the mountains,...

InterviewsTech
An Interview with Fauzia Idrees Abro
March 23, 2022
Dr. Fauzia Idrees is an Electronics engineer with her Ph.D. in Information Security Engineering and a Master’s in Information Security and Cryptology. She is the first female Ph.D. of Pakistan to...

InterviewsTech
An Interview with Cleverence Kombe
March 22, 2022
Cleverence Kombe is a cybersecurity and blockchain technology researcher and consultant. He has 8+ years experience of working with public and private organizations. He earned his Ph.D. degree in...

InterviewsEmployee AdvocacyTech
Sky Hormbrey: Onalytica’s Women in the Spotlight
March 22, 2022
In the light of International Women's Day we have decided to take the opportunity to champion some of the amazing women here at Onalytica throughout the month of March. We’ve carefully selected...

InterviewsTech
An Interview with Florian Hansemann
March 21, 2022
Florian Hansemann is the founder of a recognized company in the field of IT security, and he has a track record of top-ranking and speaker for different events over the years:
2018: Top 21...

InterviewsTech
An Interview with Lisa Ventura
March 18, 2022
Lisa Ventura is an award-winning cyber security consultant and currently looks after communications at the UK Cyber Security Council. The Council was launched in 2021 by the UK government to be the...

InterviewsTech
An Interview with Heather McGowan
March 17, 2022
Future-of-work strategist Heather E. McGowan helps leaders prepare their people and organizations for the post-pandemic world. As a keynote speaker, Heather gives lucidity to complex topics through...

InterviewsTech
An Interview with Cyndy Trivella
March 16, 2022
Cyndy began her career in Human Resources Marketing and Communications on Madison Avenue in NY City. She has a passion for discovering how technology and culture play a role in driving the...

InterviewsTech
An Interview with Hanadi El Sayyed
March 15, 2022
Hanadi is a HR industry analyst who collaborates with organizations to set the vision for their Human Resources strategy and to build different employee experiences and management practices that are...

InterviewsEmployee AdvocacyTech
Ann Duhneva: Onalytica’s Women in the Spotlight
March 15, 2022
In the light of International Women's Day we have decided to take the opportunity to champion some of the amazing women here at Onalytica throughout the month of March. We’ve carefully selected...
InterviewsTech
An Interview with Ade McCormack
March 14, 2022
A former technologist who today is focused on helping leaders thrive in an increasingly unknowable world. Ade also supports those looking to influence leaders, eg. tech service companies.
Written 6...

InterviewsTech
An Interview with Chris Herd
March 11, 2022
Chris Herd is the Founder & CEO of Firstbase. Firstbase is an all-in-one provisioning platform for remote teams. Their platform lets companies set up, supply, maintain, manage and retrieve all the...

InterviewsTech
An Interview with Claudius von Reding
March 10, 2022
Claudius is a Technology Advisor and Business Engineer. He is a Certified SAFe 5 Product Owner/Product Manager, Certified Professional for Requirements Engineering (IREB), Certified Tester (ISTQB),...

InterviewsTech
An Interview with Rod Trent
March 9, 2022
Rod Trent is a Senior Cloud Security Advocate for Microsoft and a Microsoft Sentinel global SME. He is a husband, dad, and first-time grandfather. He spends his spare time (if such a thing does truly...

InterviewsTech
An Interview with Christopher Penn
March 8, 2022
Christopher S. Penn is an authority on analytics, digital marketing, marketing technology, data science, and machine learning. A recognized thought leader, best-selling author, and keynote speaker,...

InterviewsEmployee AdvocacyTech
Andreea Moldovan: Onalytica’s Women in the Spotlight
March 8, 2022
In the light of International Women's Day on Tuesday, March 8th we have decided to take the opportunity to champion some of the amazing women here at Onalytica throughout the month of March. We’ve...

InterviewsTech
An Interview with Brian Moran
March 7, 2022
Brian is the Founder/CEO of Small Business Edge and Brian Moran & Associates. They do two things very well: They help business owners run better, more productive companies and help marketers better...

InterviewsTech
An Interview with Cheryl Cran
March 3, 2022
Cheryl Cran is a Future of Work expert and founder of NextMapping, a Future of Work consultancy. She has been named in the top ten of future work experts by Onalytica. Her thought leadership has been...

Best PracticeEducationEmployee AdvocacyTech
#OnaChat: The Future of Work
March 3, 2022
Our February #OnaChat Twitter Chat honed in on the Future of Work. This is something that impacts everyone, and having discussions like this can help employers understand how to help their employees...

InterviewsTech
An Interview with Joey Price
March 2, 2022
Joey Price is an award-winning human resources executive, business coach, thought leader, and professor. He is the founder of Jumpstart:HR, LLC, an HR consulting practice specifically for small...

InterviewsTech
An Interview with Paul Zikopoulos
March 1, 2022
Award winning pro speaker/author (21 books 360+ articles on AI/BigData/DBs). Recognized as a thought leader multiple times in the areas I talk about: AI, BigData, Anlaytics, Digital Transformation,...

InterviewsEmployee AdvocacyTech
Amardeep Sidhu: Onalytica’s Women in the Spotlight
March 1, 2022
In the light of International Women's Day on Tuesday, March 8th we have decided to take the opportunity to champion some of the amazing women here at Onalytica throughout the month of March. We’ve...

InterviewsTech
An Interview with Adi Gaskell
February 28, 2022
Adi Gaskell currently advises the European Institute of Innovation & Technology and was a futurist for the sustainability innovation group Katerva, as well as mentoring startups through Startup...

InterviewsTech
An Interview with Giselle Mota
February 25, 2022
Giselle Mota is a Principal Consultant on the Future of Work. She brings simplicity, humanity, and innovative perspective to the sometimes abstract and complex world of the future of work. These...

Influencer ListsTech
Who’s Who in Cybersecurity?
February 23, 2022
Cybersecurity applies technology, processes and controls to protect networks, devices and data from cyber attacks. It aims to reduce the risk of malware, ransomware, phishing and...

InterviewsTech
An Interview with Sharon O’Dea
February 23, 2022
Sharon O’Dea is an experienced digital strategist advising complex organizations on communication, collaboration, and digital workplace technologies for the future of work. Organizations Sharon has...

InterviewsTech
An Interview with Nick Brackney
February 17, 2022
Nick is a seasoned marketer and recognized thought leader in tech who is known for blazing new trails with emerging markets and stories, as well as supporting marketing professionals at all levels in...

InterviewsTech
An Interview with Oliver Pickup
February 16, 2022
Oliver is a London-based, multi-award-winning technology and business journalist. He has written for the Financial Times, The Times, DidiDay, The Telegraph, Wall Street Journal, among many other...
InterviewsTech
An Interview with Ravin Jesuthasan
February 16, 2022
Ravin Jesuthasan is the global leader of Mercer’s Transformation Services business. He is a recognized global thought leader, futurist, and author on the future of work and workforce...

InterviewsTech
An Interview with Neil Shah
February 15, 2022
Neil Shah is an Industry Analyst & Consultant covering the technology industry. He currently tracks, measures, and analyses the key performance, business, and financial metrics of the players in the...

Best PracticeInfluencer ActivationMarketingMeasuring Success
Influencer and Brand matchmaking: How to ensure it’s a good fit
February 14, 2022
Every time a brand decides to include influencers in their campaigns, there are a number of questions they need to answer. The same is true for influencers when they are approached by a brand to take...
Best PracticeMarketing
#OnaChat: B2B Social Media and Influencer Marketing in 2022
February 10, 2022
In our latest #OnaChat Twitter Chat, we asked experts about B2B social media and Influencer Marketing in 2022. The conversation focused on what has changed throughout the pandemic, trends that are on...

InterviewsTech
An Interview with Peter Cosgrove
February 9, 2022
Peter is Managing Director of Futurewise, a future of work insights company. Peter helps organisations navigate the future of work and the new world of remote and hybrid working. Peter has a...

InterviewsTech
An Interview with Richard Lowes
February 8, 2022
I research and communicate around the issue of how to transform the energy system from one based around dirty fossil fuel energy to a system based on clean and zero-carbon energy. My specialist area...

InterviewsTech
An Interview with George Mentz, JD, MBA, CILS, and CWM
February 7, 2022
George Mentz JD MBA CILS is an international lawyer, award-winning author, and education executive based in the United States. Mentz was recently ranked as a top influencer in the...

InterviewsTech
An Interview with Jason Falls
January 31, 2022
Jason is a thought leader and an expert on PR and Digital Strategy. He works as a digital strategist for Cornett in Lexington, Ky. (2021 Ad Age Small Agency Gold Winner in the Southeast Region). His...

InterviewsTech
An Interview with Justin Ankus
January 31, 2022
Justin is an emerging professional in the field of architecture. He grew up in the suburbs of Chicago and studied architecture at Illinois Tech. He has worked in the public sector of architecture as...

Influencer ListsTech
Who’s Who in Future of Work?
January 27, 2022
Future of Work is a projection of how work, workers and the workplace will change and evolve in the years ahead. It comes as no surprise that the COVID-19 pandemic has reshaped not only the...
InterviewsTech
An Interview with Jim Harris
January 27, 2022
Jim Harris is one of North America’s foremost thinkers on disruptive innovation speaking internationally at more than 70 virtual conferences a year. Association magazine ranked him as one of North...

InterviewsTech
An Interview with Elinor Stutz
January 26, 2022
Elinor Stutz broke through barriers long before doing so was popular. Against all the odds, she defied the theme, “women can’t sell” to become the top producer at every company she ever worked,...

InterviewsTech
An Interview with Mario Martinez Jr.
January 24, 2022
Mario is the CEO and Founder of Vengreso. He spent 96 consecutive quarters in B2B Sales and Leadership. In 2021, he earned the #1 spot in the Top 10 Most Influential Business Leaders by Beyond...
InterviewsTech
An Interview with Colin Bristow
January 20, 2022
Colin Bristow works as part of the Financial Crimes team for SAS UK&I. With over two decades of experience behind him, he has worked across Compliance, Fraud, and Risk functions within the financial...

InterviewsTech
An Interview with Dave Chaffey
January 18, 2022
Dave Chaffey is the co-founder and content director of Smart Insights and author of several bestselling digital marketing books including 'Digital Marketing: Strategy Implementation',...
Best PracticeEmployee AdvocacyMarketingMarketing Stategy
Expert Predictions on What 2022 Holds for Influencer Marketing
January 11, 2022
2021 was a busy year for the B2B influencer marketing & social media marketing space, with lots of new updates and features from the social media giants. There were lots of company acquisitions, not...

InterviewsTech
An Interview with Nadine Soyez
January 4, 2022
Nadine Soyez has many years of experience as a senior project manager and as a senior consultant in international distributed teams and projects in well-known management and IT consultancies and in...

InterviewsTech
An Interview with Professor (Dr.) Sanjay Rout
December 20, 2021
Professor Doctor Sanjay Kumar Rout is an International Researcher, Innovator, Speaker, Author, Legal Expert, Coach, Editor, Reviewer, Journalist, and Policy Expert, Coach. He is well known and highly...

InterviewsTech
An Interview with Marc Gordon
December 20, 2021
Marc is an internationally recognized thought leader in the field of customer experience. With over 25 years of marketing and sales experience in a number of diverse industries, he has built a...

InterviewsTech
An Interview with Dave Trail
December 20, 2021
Dave Trail is an accomplished industry professional, sales/business consultant, advisor, and technology evangelist with over 25 years of experience in electronics manufacturing equipment, machine...
Best Practice
Ashley Zeckman Appointed as Onalytica’s VP Strategy & Customer Success in North America
December 16, 2021
Onalytica, the world’s leading B2B Influencer Marketing SaaS platform, has appointed Ashley Zeckman as VP Strategy & Customer Success in North America.
Reporting to Tim Williams, CEO and Dominik...

InterviewsTech
An Interview with Alexander Low
December 15, 2021
Over 15 years in sales, spanning 4 industries, recruitment, accountancy, law, and commercial real estate. I have set up key client programs, underpinned by CRM use and processes. Implemented LinkedIn...

InterviewsTech
An Interview with Bob O’Donnell
December 14, 2021
Bob O'Donnell is the president, founder, and chief analyst at TECHnalysis Research, a technology market research and consulting firm that counts many of the tech industry’s largest vendors among...

InterviewsTech
An Interview with Georgios Fradelos
December 13, 2021
Over 11 years of expertise in the direction of more than 40 AI, private equity, and global business consulting projects and programs in high-impact fresh structures.

InterviewsTech
An Interview with Ivo Ronner
December 3, 2021
Ivo Ronner is the founder and president of Ronner Ventures Ltd, a Swiss-based VC and growth advisory company collaborating with passionate founders to build out and grow their international business...

InterviewsTech
An Interview with Christopher Isak
December 3, 2021
I've started my career in a technical environment that focused on audiovisual and modern collaboration technology. The objective here was to provide clients with work environments that enable them to...

InterviewsTech
An Interview with Ralf Ladner
December 2, 2021
As editor-in-chief of the magazines PC-Netze/Datacom, Network-Computing, and Funkschau for many years, Ralf Ladner has been an excellent expert on the evolution of IT and network technology, its...

InterviewsTech
An Interview with Peter Tendekayi Chingonzo
December 2, 2021
Peter Tendekayi Chingonzo is an Entrepreneur who is well trained in Project Management, Civil Engineering, Consultancy, Marketing, Technology, Plastic Recycling, Renewable energy among other...

InterviewsTech
An Interview with Hansi Mehrotra
December 1, 2021
More than 20 years experience in investment research & consulting, including setting up research platforms. Last corporate role at Mercer setting up and running wealth management division and...

Influencer ListsEnvironmentTech
COP26: Brand Share of Voice, Perception & Performance
November 30, 2021
For almost 3 decades the United Nations has been bringing countries together for global climate summits – COPs. COP stands for Conference of the Parties, and attendant countries have signed the...

InterviewsTech
An Interview with Philippe Ruttens
November 24, 2021
B2B Marketing consultant & interim manager Philippe Ruttens transforms B2B sales & marketing teams faster into revenue marketing centers of excellence. For the last 25 years, he has been helping...

InterviewsTech
An Interview with Anders Liu-Lindberg
November 19, 2021
Anders Liu-Lindberg is the co-founder and a partner at the Business Partnering Institute and owner of the largest group dedicated to Finance Business Partnering on LinkedIn with more than 10,000...

InterviewsTech
An Interview with Kirsi Larkiala
November 17, 2021
Kirsi is a dynamic and highly respected Financial Services, Banking, and Fintech senior executive with market-leading results in increasingly more complex leadership and client advisory positions.
...
Best PracticeInfluencer ActivationMarketingMarketing Stategy
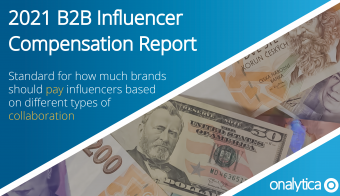
2021 B2B Influencer Compensation Report
November 16, 2021
We are delighted to have partnered up with Convince and Convert to produce the 2021 B2B Influencer Compensation Report. The first of its kind, this report sets the standard for how much brands should...

InterviewsTech
An Interview with Jay Palter
November 15, 2021
Jay is a digital business strategist, specializing in the strategic use of social influencer networks for building online visibility and brand in B2B settings. He works with businesses and...

InterviewsTech
An Interview with Peter O’Neill
November 12, 2021
Peter works as an industry analyst, collaborating with Research in Action GmbH, and with the B2B Marketing organisation in London. He also writes and curates content on an ongoing basis for several...

InterviewsTech
An Interview with Virginie O’Shea
November 12, 2021
Virginie O’Shea is a capital markets fintech research specialist, with two decades of experience in tracking financial technology developments in the sector, with a particular focus on regulatory...

InterviewsTech
An Interview with Stuart Cording
November 11, 2021
Stuart is a freelance Technical Marketing Engineer supporting SMEs to optimally promote their deep tech solutions. With 20 years of experience in the electronics industry, he leverages his technical...

InterviewsTech
An Interview with Christine Jacob, Ph.D.
November 9, 2021
With over 20 years of industry experience and a Ph.D. in Health Tech adoption, Christine is a seasoned Healthcare executive that held several leading international positions in major Pharma...

InterviewsTech
An Interview with David H. Deans
November 9, 2021
David is the Senior Partner of David H. Deans & Associates, and the founder of GeoActive Group. He has worked within multinational telecommunications, enterprise software, cloud computing, and AI,...

InterviewsTech
An Interview with Mirko Ross
November 8, 2021
Former Hacker – still associated with the white-hat hacker community
Advisor – EU Commission, ENISA, EBRD
Cybersecurity and IoT Researcher
Geek, Nerd, Podcaster, Author
CEO at Asvin – Security...

InterviewsTech
An Interview with Tina Gravel
November 8, 2021
A cyber security executive, Tina Gravel is SVP Global Channels at Appgate, a secure access software, and services company. Tina has served as a Senior Executive in many IT firms for the past 20...


InterviewsTech
An Interview with Raj Kosaraju
November 4, 2021
CIO who also has interests in entrepreneurial activities and mindsets. Specializes in Cloud Computing, Data Warehousing, Business Intelligence, IoT & Big Data.

InterviewsTech
An Interview with Philip Benton
November 2, 2021
Philip is a senior analyst in the financial services team at Omdia, a market-leading technology research and consulting firm. Philip specialises in digital banking and payment trends as well as a...

InterviewsTech
An Interview with Jan Rosenow
November 2, 2021
Dr. Jan Rosenow is a Principal and Director of European Programmes at the Regulatory Assistance Project (RAP), a global team of highly-skilled energy experts. Jan has several board appointments...
InterviewsTech
An Interview with Markus Eisele
November 1, 2021
Markus is a Java Champion, former Java EE Expert Group member, founder of JavaLand, reputed speaker at Java conferences around the world, and a very well-known figure in the Enterprise Java world.
He...
InterviewsTech
An Interview with Channa Prakash
October 29, 2021
Dr. Channa S. Prakash, is the Dean of the College of Arts and Sciences (CAS) at Tuskegee University (USA) where he has served on the faculty since 1989. He is a professor of crop genetics,...
InterviewsTech
An Interview with Thorsten Wuest
October 28, 2021
Thorsten Wuest is an associate professor at West Virginia University and globally recognized as one of SME’s 20 most influential professors in smart manufacturing. Dr. Wuest has co-authored 3...
InterviewsTech
An Interview with Pravash Dey
October 26, 2021
Pravash Dey is a serial entrepreneur, mentor, and philanthropist (Rotarian). He is the founder of the US India Blockchain Council, Mobile Technology Park (India), and Enterprise India Foundation...
Best PracticeGetting StartedMarketing
What do brands look for when selecting an influencer?
October 21, 2021
Selecting the right influencer with the right audience for a campaign is essential for achieving success. The process of influencer identification is a lot more streamlined now than it used to be....
InterviewsTech
An Interview with Dalith Steiger
October 19, 2021
Dalith Steiger belongs to the top 10 pioneering women in cognitive technologies and is one of the top digital shapers and leading voices in the global AI ecosystem. Dalith was born in Israel, grew up...

InterviewsTech
An Interview with Bojan Tunguz
October 14, 2021
Bojan is a Machine Learning Modeler at NVIDIA. He has been working in Machine Learning and Data Science fields for seven years and has experience with real-world FinTech problems. He is a Quadruple...

Influencer ListsEnvironmentTech
Environmental Sustainability: A Study into Tech Brands’ Perception & Impact
October 14, 2021
Environmental sustainability aims to avoid the exhaustion of natural resources in hopes of maintaining an ecological balance and preventing climate change.
According to the United Nations, the...
InterviewsTech
An Interview with Dr. Catriona Wallace
October 12, 2021
Dr. Catriona Wallace is a specialist in the field of Artificial Intelligence and is an AI company founder, Adjunct Professor, keynote speaker, Chair of an AI Venture Capital Fund, and is the Director...

InterviewsTech
An Interview with Paige McNamee
October 12, 2021
Paige is a Reporter for Finextra Research, specializing in payments, digital currency, and regulation.

InterviewsTech
An Interview with Sagrika Shah
October 12, 2021
Sagrika is a co-founder at ConnexDoor, a strategic enabler platform that helps establish collaborations within the start-up ecosystem. Her interest lies in how new economies will take shape based on...

InterviewsTech
Interview with Asif Razzaq
October 4, 2021
Asif Razzaq is an AI Journalist and Cofounder of Marktechpost, LLC. He is a visionary, entrepreneur and engineer who aspires to use the power of Artificial Intelligence for good.
Asif's...

InterviewsTech
Interview with Asokan Ashok
October 4, 2021
Asokan Ashok, CEO of UnfoldLabs, an Innovative & Strategic Product Development Company in Mobile & Cloud Platform Technologies. Ashok has expertise in driving customer insights into thriving...

InterviewsTech
Interview with Rimah Harb
October 4, 2021
Rimah Harb is the VP of Commercial at Teralight and an Advisor to Singularity Studio, Pure Technology, and BlockQuake. Rimah spent over 15 in the telecom and technology industry serving major...
InterviewsTech
Interview with Toby Walsh
October 1, 2021
Toby Walsh is a Laureate Fellow and Scientia Professor of AI at UNSW Sydney and CSIRO Data61, and adjunct professor at QUT. He is a strong advocate for limits to ensure AI is used to improve...

InterviewsTech
Interview with Louis Bouchard
October 1, 2021
Louis Bouchard is from Montreal, Canada, also known as "What's AI". He focuses on making AI accessible through his blog posts, newsletter, and YouTube videos. Louis trie to share and explain...

InterviewsTech
Interview with Craig Smith
October 1, 2021
Craig S. Smith is an American journalist and former executive of The New York Times. Until January, 2000, he wrote for The Wall Street Journal, most notably covering the rise of the religious...

Influencer ListsTech
Who’s Who in AI?
September 22, 2021
By 2026, Artificial Intelligence (AI) will drive the greatest technological breakthroughs in the industries of automotive, banking, computing, energy and healthcare.
SwissCognitive is closely...
InterviewsFinance
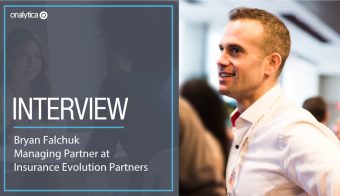
Interview with Bryan Falchuk
September 17, 2021
Bryan Falchuk is the Founder and Managing Partner of Insurance Evolution Partners, which advises carriers and their partners on how to navigate an evolving industry facing disruption and change....

InterviewsFinance
Interview with Saeed Valadbaygi
September 13, 2021
Saeed Valadbaygi is a top global influencer in FinTech, Blockchain, Big Data, Risk, and innovation. He is also an activist, editor, technologist, and analyst with a history of working with labor...

InterviewsFinance
Interview with Larry English
September 13, 2021
Larry is author of Office Optional: How to Build a Connected Culture With Virtual Teams, a roadmap to virtual work success. The book draws on his insights as cofounder and president of Centric...

InterviewsTech
Interview with Joe Devon
September 13, 2021
Joe Devon is the Co-Founder of Diamond – a digital agency that builds accessible experiences, co-founder of Global Accessibility Awareness Day, and Chair of the GAAD Foundation. His goal is...
InterviewsFinance
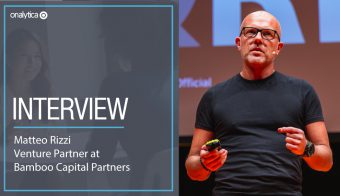
Interview with Matteo Rizzi
September 13, 2021
Matteo Rizzi is an unconventional entrepreneur with two decades of experience in Financial Services, constantly referred amongst the top executives in the industry. He spent 13 years at SWIFT –...

InterviewsFinance
Interview with Chris Skinner
September 13, 2021
Chris Skinner is known as one of the most influential people in technology, financial markets and Fintech through his blog, the Finanser.com. His latest book is "Doing Digital", sharing the lessons...

InterviewsFinance
Interview with Chris Gledhill
September 13, 2021
Chris Gledhill is an independent FinTech Futurist, Speaker, Writer and Advisor. Chris regularly ranks as a top global FinTech influencer and is considered a thought leader in FinTech, Banking and the...

Best PracticeGetting StartedMarketing
Ethical Considerations When Posting and Amplifying Content
August 26, 2021
Influencers and thought leaders have a persuasive power both online and offline to impact decision makers. Equally, they usually have large audiences that look up to them for their expertise and...

Influencer ListsTech
Who’s Who in Fintech?
August 18, 2021
Fintech aims to challenge the finance industry by improving and automating the delivery and use of financial services. Fintech is employed to help companies and consumers better manage...

InterviewsTech
Interview with Dan Bladen
August 17, 2021
Dan is Co-founder & CEO at Chargifi, where he and the Chargifi team are building an operating system for hybrid working. Dan is a patent author, keynote speaker and has served on the leadership teams...

InterviewsTech
Interview with Christian Frei
August 17, 2021
Christian is a Strategic Business Leader with a remarkable depth of understanding of technological leadership.
Over the course of an 18-year career at Microsoft, Christian has attracted and...

InterviewsTech
Interview with Rana Florida
August 17, 2021
As Chief Executive Officer of the Creative Class Group, Rana Florida manages new business development, marketing, consulting, research and global operations serving such diverse clients as...

InterviewsFinance
Interview with Urs Bolt
August 17, 2021
30+ years experience in wealth management, investment banking and related technology businesses. My core expertise is to develop and roll out new digital business platforms. My current focus is to...
Best PracticeMarketing
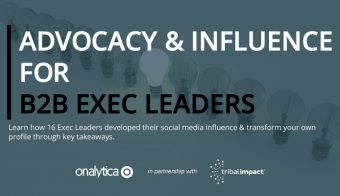
Advocacy and Influence for B2B Exec Leaders
August 12, 2021
We are living in an age dominated by social media. Most brands have a social presence, and over half of the global population is now on social media. Gone are the days of asking people for their...

InterviewsTech
Interview with Jennifer Brown
August 11, 2021
Jennifer Brown (she/her) is an award-winning entrepreneur, speaker, author, and diversity and inclusion expert who is deeply passionate about building more inclusive workplaces where more of...

InterviewsTech
Interview with Christiaan Lustig
August 11, 2021
I consult with organisations mainly in healthcare, education, and government on internal digital communications, service, and collaboration. This includes digital workplace and intranet...

InterviewsTech
Interview with Shauna Moran
August 11, 2021
Shauna Moran is the founder of Operate Remote- an accredited and award-winning executive coaching agency that empowers CEOs and their remote teams to create and build more emotionally...

InterviewsTech
Interview with Carl March
August 11, 2021
In his role as Director – Industry 4.0 at Stanley Black & Decker (SBD), Carl is responsible for leading the innovation, strategy, and implementation of smart manufacturing technologies...

InterviewsTech
Interview with Darren Murph
August 11, 2021
Named an “oracle of remote work” by CNBC, Darren serves as GitLab’s Head of Remote. A visionary in organizational design, he works at the intersection of culture, operations, people,...

InterviewsTech
Interview with Jennifer Stirrup
August 11, 2021
Jennifer Stirrup is the Founder and CEO of Data Relish, a UK-based AI and Business Intelligence leadership boutique consultancy delivering data strategy and business-focused solutions. Jen...

InterviewsTech
Interview with Rich Rogers
August 11, 2021
Rich Rogers is the Co-founder and CEO of Xemelgo, a Seattle-based Industry 4.0 software company. Prior to founding Xemelgo, Rich spent 12-years at Hitachi, most recently driving their Global...

InterviewsTech
Interview with Edmund Asiedu
July 30, 2021
Edmund is a passionate disability inclusion professional with successful experience in advocating for accessibility. He uses he/him/his pronouns. Before joining NYC Department of Transportation as a...

InterviewsTech
Interview with Ian Gardner
July 30, 2021
Over 25 years’ experience in high complexity projects around Industry 4.0 and ERP. Ian is an expert in Industry 4.0 and speaks regularly at events and lectures at universities. Currently...

InterviewsTech
Interview with Vessy Tasheva
July 30, 2021
Originally Bulgarian and based out of Ireland, Vessy Tasheva is the Founder & CEO of Vessy.com (D&I and Mental Health consultancy) with a fully remote team spread across the world. Vessy.com...

InterviewsTech
Interview with Maya Middlemiss
July 30, 2021
Working from home and leading remote teams since 2000, Maya Middlemiss is a native Londoner now location-independent in Eastern Spain. From there she writes/consults/speaks on a variety of...

InterviewsTech
Interview with Gren Gale
July 28, 2021
There’s little doubt in my mind that project management is a hard job. Despite this I stuck at it for over 20 years before becoming a consultant with the aim of helping others to learn from...

Influencer ListsTech
Who’s Who in Remote Working?
July 28, 2021
Remote Working is a work style allowing professionals to work outside of the traditional office environment. In 2020, the world was forced to move to this new working model, with many employees as...

InterviewsTech
Interview with Molly Watt
July 23, 2021
Molly is 26 years old and has a condition called Usher Syndrome, which causes deaf-blindness and has no cure. She is director of Molly Watt Talks, a usability and accessibility consulting...

InterviewsTech
Interview with Jameel Istaitih
July 23, 2021
Jameel Istaitih; Vice President industry 4.0 at Razor Labs, an innovative company that fuses the power of Deep Learning with human experience to unlock the next big leap in productivity,...

InterviewsTech
Interview with Martin Cloake
July 16, 2021
Martin Cloake is the CEO of Raven.ai, a company that delivers transformational improvement to global manufacturers by guiding front-line workers to take smarter steps on the plant floor with...

InterviewsTech
Interview with Filipa d’Orey
July 16, 2021
Being a Business Development Specialist for Critical Manufacturing is joining the best of two worlds - enjoying what i do, where i do it. Working hard and working out go hand-in-hand in my...

InterviewsTech
Interview with Matthew Rimmer
July 14, 2021
Dr Matthew Rimmer is a Professor in Intellectual Property and Innovation Law at the Faculty of Business and Law, at the Queensland University of Technology (QUT). He has published widely on...

InterviewsTech
Interview with Chris Luecke
July 12, 2021
Chris Luecke is a Podcaster, Marketer, and Content Creator in the manufacturing industry. As the host of the show Manufacturing Happy Hour, Chris interviews leaders in the industrial sector to...

InterviewsTech
Interview with Blair Pleasant
July 8, 2021
Blair Pleasant is President & Principal Analyst of COMMfusion LLC and a co-founder of BCStrategies (formerly UCStrategies). As a communications industry analyst, she provides strategic...

InterviewsTech
Interview with Jesus Hoyos
July 8, 2021
Jesús is an Independent Analyst, Speaker, Blogger and Influencer in CRM, Marketing, Customer Engagement and Social Media, with expertise in the Latin American market and integrating marketing...

InterviewsTech
Interview with Markus Wuebben
July 5, 2021
Markus is Co-Founder of CrossEngage - the intelligent Customer Data Platform. For his entire career he has been working on the intersection of Marketing, Tech, and Data with a special focus on CRM,...

InterviewsTech
Interview with Erwin Rauch
July 5, 2021
I am an Assistant Professor at the Free University of Bolzano and the Head of the Smart Mini Factory Lab for Industry 4.0. I have a B.Sc. degree from Free University of Bolzano, a MSc. and an...

InterviewsTech
Interview with Ira Sharp
July 5, 2021
Ira is an industrial automation expert with 15 years of experience, with a focus on Open Control, IIoT, Industry 4.0, networking, and Cyber Security. Ira is an industry event speaker, has...

InterviewsTech
Interview with Andrew Sheves
July 5, 2021
Andrew Sheves is a risk, crisis, and security manager with over 25 years experience managing risk in the private and public sectors. He has provided risk, security, and crisis management support to...
Influencer ListsB2BTech
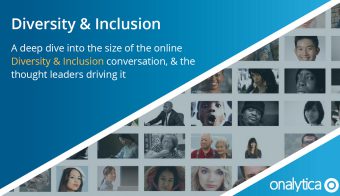
Diversity and Inclusion: Thought Leaders & Online Discussion
July 1, 2021
Diversity & Inclusion initiatives are part of a company’s practice and mission to create a non-biased, diverse, and inclusive workforce. With more and more research being done on D&I and...

InterviewsTech
Interview with Valentino Zocca
June 30, 2021
I studied Mathematics in Italy, the UK and the US, and I did a post-doc in France. I then worked in satellite image analysis where I started to focus on Machine and Deep Learning in order to...

InterviewsTech
Interview with Joachim Hensch
June 30, 2021
Prepare for your Digitalization or prepare for your Bankruptcy! A harsh statement that I heard in a conversation with a factory owner from Bangladesh. But somehow it resonated with the experience...

InterviewsTech
Interview with Yohan Rodriguez
June 29, 2021
Yohan Rodríguez is a software developer, book/article writer, researcher and blogger with nearly 20 years of experience in computer science. He received his education at the University of...

InterviewsTech
Interview with Ken Forster
June 24, 2021
Digital Industry veteran building ‘connected’ products, services, and businesses for over 30 years with senior leadership roles at ThingWorx, Syngenta, Coca-Cola and Philip Morris. He...
InterviewsTech
Interview with Stephanie Atkinson
June 24, 2021
Stephanie Atkinson is a leading executive, thought leader, influencer, marketer, speaker, strategist, analyst, and advisor. She owns and runs CompassIntel.com and vMarque.com, while also serving on...

InterviewsTech
Interview with Chirag Khimani
June 24, 2021
Chirag is an automation testing expert, trainer, and motivational speaker who loves to automate anything! He has a strong understanding of automation toolset, processes & standards to...

Best PracticeNews
Onalytica Launches the World’s Largest B2B Influencer Marketplace, MyOnalytica
June 23, 2021
We are incredibly proud and excited to announce the official launch of MyOnalytica – the world’s largest B2B influencer marketplace.
Onalytica have been connecting topical experts with global...
Best PracticeGetting StartedMarketing
The Dos and Don’ts of Being an Influencer
June 22, 2021
Becoming an influencer is not a quick process, it takes a long time to build up a reputation for being an expert on a particular topic. It can take years of regularly posting about that topic to...

InterviewsTech
Interview with Dr. Hassan Rashidi
June 21, 2021
Dr. Hassan Rashidi is an engineer, keynote speaker, and advisor at DrRashidi.com. He provides industries, universities, and people with knowledge and insights on advances, innovations, and...

InterviewsTech
Interview with Michaela Underdahl
June 21, 2021
Michaela heads up marketing at Nimble, a leading provider of simple, smart CRM for small business teams using Microsoft 365 or Google Workspace. Nimble combines the strength of traditional...

InterviewsTech
Interview with Anna Lagerhed
June 21, 2021
Anna has 20+ years experience from process development, management and project management. For the last few years, RPA and Intelligent Automation have been her main areas. She now leads the...

Influencer ListsTech
Who’s Who in Industry 4.0?
June 17, 2021
Industry 4.0, also known as the Forth Industrial Revolution/4IR, represents the digital transformation of manufacturing and production industries as well as value creation processes.
It is closely...

Best PracticeEnvironment
Onalytica & TNC analyse nature-related social media conversations pre, during & post COVID
June 16, 2021
Onalytica are really pleased to launch a report in collaboration with The Nature Conservancy (TNC), analysing the social media conversations from January 2020 - March 2021, on nature-related topics...
InterviewsTech
Interview with Peter Lavers
June 15, 2021
Peter is an expert in customer experience (CX) management and CRM, delivering value and efficiencies through the systemic management of one of the key assets of any B2C, B2B or Intermediated...

InterviewsTech
Interview with Dr Iniobong Enang
June 15, 2021
I am a Senior Lecturer/Assistant Professor in Risk Management, and Course Director of MSc Risk Management at Coventry University, in England. I have taught and lectured in the business schools at the...

InterviewsTech
Interview with Nandan Mullakara
June 14, 2021
Nandan Mullakara is the CEO of Innomatiq, an automation consulting firm that is helping organizations to discover, develop, and deploy automation with Robotic Process Automation (RPA) and Artificial...

InterviewsTech
Interview with Franco Ronconi
June 14, 2021
A successful Business Operations Manager with a strong background in fast-paced, technology driven industries, and with an effective combination of leadership, innovation and long-term vision....
InterviewsTech
Interview with Kevin Craine
June 14, 2021
Kevin Craine is a professional writer and award-winning podcast producer. He was named the #1 Enterprise Content Management Influencer to follow on Twitter and has listeners and readers worldwide. He...

InterviewsTech
Interview with Dr. Karl Michael Popp
June 14, 2021
Karl is a member of the Corporate Development and Strategy Team in the Office of the CEO at SAP SE in Germany. In his twenty-five year career at large and small software companies, he has...

InterviewsTech
Interview with Thomas Brannen
June 14, 2021
Thomas Brannen is an independent industry analyst/influencer, focusing on the technologies that drive human convergence, including Augmented and Virtual Reality, Unified Communications and...

InterviewsTech
Interview with Dave Michels
June 14, 2021
Dave Michels, a self proclaimed communications protagonist, is the founder of TalkingPointz which offers commentary and research including a well known monthly Insider’s Report. Dave’s unique...

InterviewsTech
Interview with Paula Piccard
June 14, 2021
Proud Startup Owner. Multilingual NewYork-er. Women in Tech & Cybersecurity Advocate. Digital Marketing Guru & Social Media Influencer, Paula Piccard was born in Puerto Rico. 20+ years of...

InterviewsTech
Interview with William Jepma
June 14, 2021
William Jepma is an editor, writer, and analyst at Solutions Review who aims to keep readers across industries informed and excited about the newest developments in Enterprise Resource Planning...

InterviewsTech
Interview with Mike Aoki
June 11, 2021
Mike Aoki is the President of Reflective Keynotes Inc., a Canadian training company that helps contact centers improve their sales and customer experience results. A contact center expert, Mike was...

InterviewsTech
Interview with Susan Hash
June 11, 2021
Susan Hash is a freelance B2B writer/journalist with 28 years of specialised experience writing about customer care, customer service and contact centers.

InterviewsTech
Interview with David Danto
June 11, 2021
David Danto has had over four decades of delivering successful business outcomes in media and collaboration technology. He developed and executed global technology strategies in leadership roles...
InterviewsTech
Interview with Phil Simon
June 10, 2021
Phil Simon is a frequent keynote speaker, recognised collaboration and technology authority, and college professor-for-hire. He is the award-winning author of eleven books, most recently Reimagining...

InterviewsTech
Interview with Hernan Huwyler
June 10, 2021
Professor Hernan Huwyler is a risk and compliance specialist for multinational companies for over twenty years. He is focused on developing practices and controls to address business risks and legal...

InterviewsTech
Interview with Tichaona Chitsinde
June 10, 2021
A Governance Risk Management and Compliance professional passionate about solutions that are mutually beneficial to the implementors, customers receiving service and the spirit behind the...

Influencer ListsTech
Who’s Who in Automation?
June 3, 2021
Automation is the application of technologies to deliver services with minimal human intervention. Menial and repetitive jobs previously performed by humans are being increasingly automated. If...
Best Practice
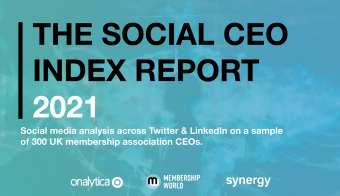
The Social CEO Index – How Influential are Membership Association CEOs?
June 2, 2021
We are delighted to have partnered up with Membership World and Synergy, to produce The Social CEO Index Report analysing UK membership association CEOs' social media activity and online...
InterviewsTech
Interview with Irwin Lazar
June 1, 2021
Co-Founder, President and Principal Analyst at Metrigy leading digital workplace workplace research including unified communications, collaboration, and supporting technologies. Over 20 years...

InterviewsTech
Interview with Andrew Wood
May 26, 2021
Thought leadership in Future of Work, Digital Workplace and Digital Customer Experience.
Extensive global experience in Cloud Unified Communications, Team Collaboration, Contact Centre and...
InterviewsTech
Interview with Stephanie Thum
May 25, 2021
Long-time practitioner, consultant, and advocate for customer experience in B2B and government. Multimedia content creator. Creator and host of the Mitel Minute. Past: Creator and host of...

InterviewsTech
Interview with Dr. Robin Kiera
May 20, 2021
Dr. Robin Kiera has been one of the most influential voices in the international insurance industry for years. After several high ranking positions in insurance, start-ups and banking he founded...

InterviewsTech
Interview with Glen Alleman
May 18, 2021
Glen leads Program Planning and Controls in the DOD, DOE, and NASA business domains. In this position Glen’s brings more than 30 years experience in program management, systems engineering, Risk...

InterviewsTech
Interview with Jeff Kagan
May 17, 2021
Over the past 30 years, Jeff Kagan has become one of the best known and most influential Industry Analysts, columnists, key opinion leaders and thought leaders. He follows wireless, telecom,...

InterviewsTech
Interview with Jon Arnold
May 17, 2021
Jon Arnold is Principal of J Arnold & Associates, an independent analyst practice providing thought leadership and go-to-market counsel, with a focus on the business-level impact of digital...

InterviewsTech
Interview with Ginger Conlon
May 17, 2021
An award-winning editorial leader who has covered marketing and CX for the majority of her career, Ginger Conlon is currently thought leadership director at Genesys. Additionally, she serves as...
InterviewsTech
Interview with Bill Quiseng
May 14, 2021
Bill Quiseng is an award-winning hospitality leader and customer service expert with over 30+ years in luxury hotel/resort management. He speaks and blogs about customer service, customer...

InterviewsTech
Interview with Alexander Larsen
May 13, 2021
President of Baldwin Global Risk Services Ltd, founder of Risk Guide, and host of "Risk Managers Getting Coffee", I am a Risk Management practitioner with 20 years of experience in various...

InterviewsTech
Interview with Norman Marks
May 13, 2021
Norman Marks, CPA, CRMA is a retired senior executive. He works with individuals and organisations around the world, advising them on risk management, internal audit, corporate governance,...

Influencer ListsTech
Who’s Who in Unified Communications?
May 12, 2021
The term unified communications (UC) describes the integration of various communication tools to facilitate quick and hassle-free communication. UC incorporates real-time, enterprise, communication...
InterviewsTech
Interview with Ravit Jain
May 11, 2021
Ravit Jain, host of "The Ravit Show" and Community Manager at Packt Publishing, is an amazing personality with a love for data and interacting with people! Ravit is passionate about supporting...

InterviewsTech
Interview with Anna Sabryan
May 10, 2021
Anna is a seasoned Social Media and Digital Marketing professional with a passion for community building and storytelling. She is creative-minded with a “can do” attitude and considers...

InterviewsTech
Interview with Fabien Prevots
May 10, 2021
With a doctorate in microbiology, I have also followed a master's degree in finance and business executive training. After having been Research and Development Director of a branch of Sanofi, I...

InterviewsTech
Interview with Elson Sutanto
May 10, 2021
Elson is currently a Principal Analyst with Juniper Research, a leading provider of research, analysis and consultancy services to the mobile and digital technologies sectors. Elson’s key interests...

InterviewsTech
Interview with Markus Grutzeck
May 6, 2021
Markus Grutzeck assumed the CRM provider Grutzeck-Software from his parents in 1996. The originally founded in 1979 with the purpose to provide (CRM-)software for marketing, sales and...

InterviewsTech
Interview with Chuck Schaeffer
May 6, 2021
Chuck is the North America Go-to-Market Leader for IBM's CRM and ERP consulting practice. He is also enjoys contributing to his blog.
InterviewsTech
Interview with Jan Matthes
May 6, 2021
Jan Matthes is Chief Product Manager and head of product management in SAP Business ByDesign Cloud ERP. Besides leading the overall strategy he is subject matter expert in various topic like...

InterviewsTech
Interview with Dave McCarthy
May 5, 2021
Dave McCarthy is a Vice President within IDC's worldwide infrastructure practice, where he leads a team of analysts covering shared (public) cloud, dedicated (private) cloud, and edge strategies....

InterviewsTech
Interview with Michael Cavaretta
May 5, 2021
Michael Cavaretta is an Analytics Executive at Ford, having had multiple roles in Global, Insights, Data and Analytics (GDIA). Since joining in 2015, he’s worked in connected vehicles, analytics...

InterviewsTech
Interview with Anthony Rochand
May 5, 2021
CEO and Co-Founder of LEW (Les Experts du Web) - Trainer / Mentor in Influence Communication & Social Marketing / Blogger - Top Voice France on Twitter and LinkedIn in Social Media &...

InterviewsTech
Interview with Niel Kirk
May 5, 2021
I am a business development professional, with 20 years’ experience leading large scale bids for technology opportunities, across the public and private sector, and internationally. Using...

InterviewsTech
Interview with Stéphanie Walter
May 4, 2021
Stéphanie is a Senior User Researcher and Product Designer based in Luxembourg. She builds user-centred, inclusive and accessible products and services for a wide range of clients in various...

InterviewsTech
Interview with Ivana Taylor
April 29, 2021
Ivana Taylor is the publisher of DIYMarketers.com where small business owners get low-cost tools, tips and strategies to do marketing on about $17 a day. Her popular #BizapaloozaChat weekly...

Influencer ListsTech
Who’s Who in Risk Management?
April 28, 2021
Risk management is a process of establishing decisions that will decrease adverse effects of numerous risks on an organisation. Risk management software aims to observe and identify a variety of...

InterviewsTech
Interview with David Teich
April 27, 2021
David A. Teich has four decades of experience in the business of technology. Experience in marketing, sales, professional services, development and operations means that David can help growing...

InterviewsTech
Interview with Sergios Karagiannakos
April 27, 2021
I am a Machine Learning Engineer with a specific focus on Deep Learning and Machine Learning Infrastructure. In 2018, I founded AI Summer, a blog around Deep Learning, with the sole purpose to...

InterviewsTech
Interview with Rosaria Silipo
April 26, 2021
Rosaria Silipo, PhD, principal data scientist now at KNIME, has spent 25+ years in applied AI, predictive analytics and machine learning at Siemens, Viseca, Nuance Communications, and private...

InterviewsTech
Interview with Mike Dano
April 26, 2021
Mike Dano is Light Reading's Editorial Director, 5G & Mobile Strategies. He has covered the wireless industry as a journalist for almost two decades, first at RCR Wireless News and then at...

InterviewsTech
Interview with Doug Mohney
April 26, 2021
Doug Mohney has been working in and writing about IT and satellite industries for over 20 years. His real world experience including stints at two start-ups, a commercial internet service provider...
InterviewsTech
Interview with Chantel Cary
April 26, 2021
Chantel is a Senior Analyst in Omdia's (formerly Ovum) Service Provider Operations and IT team. She provides thought leadership, forecasts, vendor assessments, and competitive analysis for the...

InterviewsTech
Interview with Diego Oppenheimer
April 26, 2021
Diego Oppenheimer is co-founder and CEO of Algorithmia, the enterprise MLOps platform, where he helps organisations scale and achieve their full potential through machine learning. Algorithmia puts...

InterviewsTech
Interview with Daniel Gutierrez
April 26, 2021
Daniel D. Gutierrez is a data scientist with Los Angeles-based AMULET Analytics. He’s been involved with data science and Big Data long before the fields came in vogue. As a Big Data journalist, he...

InterviewsTech
Interview with Isaac Sacolick
April 26, 2021
Isaac Sacolick is the President of StarCIO, where he guides clients on succeeding with data and technology while executing smarter, faster, safer, and more innovative transformation programs. He is a...

InterviewsTech
Interview with Marcus Borba
April 21, 2021
Consultant, tech expert, entrepreneur, executive, passionate about innovation and digital transformation. More than three decades of in depth business and information technology experience, and more...
InterviewsTech
Interview with Ricardo Anaya
April 21, 2021
20 years of experience in the wireless industry: Carriers OEMS ( Device Manufacturers); Infrastructure vendors; Semiconductor Provider (Qualcomm;) Working in LATAM to take the next step on 4G (LTE,...

InterviewsTech
Interview with Michael Lemm
April 15, 2021
My military experience of 23 years in the U.S. Navy and being able to travel the world exposed me to the global demand for telecom and information technology (IT) services. This also afforded me the...
Influencer ListsTech
Who’s Who in Customer Relationship Management?
April 14, 2021
Customer relationship management (CRM) is utilised by companies to analyse and manage customer interactions and data. CRM systems collate customer data across a variety of channels, as well as points...

InterviewsTech
Interview with Thomas Harrer
April 13, 2021
As a Chief Technology Officer, Thomas and his team deliver innovation with hybrid cloud and AI, leveraging all types of data and evolving the technology to enable clients to address new digital...

InterviewsTech
Interview with Jacob Miknuk
April 12, 2021
I am the Data Dude! Big Data and everything analytics champion. The world of analytics is changing so quickly and it is exciting to talk about and spark ideas in the greatest minds of our generation...

InterviewsTech
Interview with Thomas Wieberneit
April 9, 2021
Thomas is an executive, entrepreneur and consultant with more than 25 years of proven track record of leadership experience in the software industry, business and IT consulting. He is an experienced...

InterviewsTech
Interview with David Menninger
April 6, 2021
David is responsible for the overall research direction for data, information and analytics technologies at Ventana Research covering major areas including Analytics, AI/ML, Big Data, Business...

InterviewsTech
Interview with Duena Blomstrom
April 6, 2021
Duena is the author of “Emotional Banking: Fixing Culture, Leveraging FinTech and Transforming Retail Banks into Brands”. She is an entrepreneur and Angel Investor, a mentor, a blogger with...

Best PracticeMarketing
Has Twitter’s Flurry of Features Changed the Balance of Power in the Influencer Ecosystem?
April 1, 2021
With moves to let influential users publish newsletters, host social audio rooms and paywall exclusive content, Twitter has signalled its intent to stake a claim for the creator economy.
If the...

Influencer ListsTech
Who’s Who in Telecoms?
March 31, 2021
Telecommunications, also known as telecoms, is defined as the exchange of information by electronic means over large distances. The definition includes data, voice and video transmissions as well as...

InterviewsTech
Interview with Harry Kimpel
March 30, 2021
Passionate Software Architect with experience in a broad spectrum of development technologies and platforms. Always learning, applying what's state of the art and (more importantly) looking what's...

InterviewsTech
Interview with Alberto Garuccio
March 29, 2021
Married, 42 years old, based in Turin, Alberto is a manager with a background in Business Innovation and Finance and over 20 years’ experience across Financial Services industry. Former KPMG, FCA,...

InterviewsTech
Interview with Gerson Rolim
March 27, 2021
Specialist in Digital Economy and disruptive technologies, working since 1993 in Technological Innovation, I am founder & CEO of Intellimetri, founder & Board Member of Observatore and Vecto Mobile,...

InterviewsTech
Interview with Elitsa Krumova
March 26, 2021
Elitsa Krumova is a recognized professional in the Marketing and Advertising industry as well as in the IT industry. Her diverse educational background, with BA of Honours in Advertising and...

InterviewsTech
Interview with Anthony Alford
March 26, 2021
Anthony is a Development Group Manager at Genesys Cloud Services, where he is working on several AI and ML projects related to customer experience. He has over 20 years experience in designing and...

InterviewsTech
Interview with Gerald Bader
March 26, 2021
Gerald is leading the AI, Automation & Analytics practice within Atos and has more than 20 years of experience in IT in multinational industries and companies. He has proven leadership experience in...

InterviewsTech
Interview with Steven Vaughan-Nichols
March 26, 2021
Steven J. Vaughan-Nichols (aka sjvn) has been writing about technology and the business of technology since CP/M-80 was the cutting-edge PC operating system, 300-bps was a fast Internet connection,...

InterviewsTech
Interview with Andrew McFarland
March 26, 2021
Andrew McFarland has more than 25 years’ experience in executive leadership, including significant roles in global public and private companies with revenues between $10M and $14B.
Known as an...

InterviewsTech
Interview with Terence Mills
March 24, 2021
AI & blockchain solutions pioneer. A six-time CEO, Terence Mills is the CEO of AI.io, an industry leading data science and engineering company that envisions, conceptualizes, and delivers AI...

InterviewsTech
Interview with Klaus Roder
March 24, 2021
Klaus has a comprehensive business & technical skillset in the areas of Software Development, Data Management, AI, Design Thinking and Product Management. He successfully led a range of technical,...

InterviewsTech
Interview with Martin Hosken
March 22, 2021
Martin Hosken is the Worldwide Chief Technologist for VMware Cloud Services. Martin works at the intersection of IT Architecture, Solution Architecture and Software Development. His primary focus is...

InterviewsTech
Interview with Randy De Meno
March 20, 2021
27+ year Commvault veteran that introduced heterogeneous data management for Commvault & Commvault's partnership with Microsoft and their eco-system. Multi-dozen patent holder. Randy's focus is...

InterviewsTech
Interview with Efi Pylarinou
March 18, 2021
I am a Global Fintech Influencer (No.1 Global Woman Influencer in Finance & the Dataconversation by Refinitiv 2019 & 2020) and a seasoned Wall Street professional with a Ph.D. in Finance. I run an...
InterviewsTech
Interview with Daniel Oh
March 18, 2021
Daniel Oh is a Principal Technical Product Marketing Manager at Red Hat and works CNCF/DOIS ambassador as well. He's well recognized in cloud-native app dev, senior DevOps practices in many open...

InterviewsMarketing
Interview with Tom Augenthaler
March 17, 2021
Tom Augenthaler is the founder of 551 Media LLC, an influencer marketing consultancy that helps clients around the world.
He founded his website, The Influence Marketer, to share his ideas and...
Influencer ListsTech
Who’s Who in Data Science and Machine Learning?
March 17, 2021
Data Science combines statistical and computational skills together with Machine Learning for data-driven problem solving. This rapidly growing area includes large-scale data analysis, DevOps and...

InterviewsHealth
Interview with Robin Farmanfarmaian
March 16, 2021
Robin Farmanfarmaian is a professional speaker and entrepreneur working in tech poised to impact 100M people or more. Farmanfarmaian is the co-founder of Face Touch Aware, an Apple Watch App to...

InterviewsFinanceTech
Interview with Matteo Carbone
March 13, 2021
Founder and Director of the IoT Insurance Observatory, NED and Chairman of the Innovation Advisory Board at Net Insurance, and Global Ambassador of the Italian InsurTech Association. Internationally...

InterviewsTech
Interview with Peter Tendekayi Chingonzo
March 11, 2021
Peter Tendekayi Chingonzo is an Entrepreneur who is well trained in Project Management, Civil Engineering, Consultancy, Marketing, Technology, Plastic Recycling, Renewable energy among other...
InterviewsTech
Interview with Judith Hurwitz
March 10, 2021
Judith Hurwitz is president of Hurwitz & Associates, a consulting, research, and analyst firm focused on cloud computing, machine learning and AI, security, and manageability of hybrid systems. As a...

InterviewsTech
Interview with Dr Dorothea Baur
March 10, 2021
Dorothea is an independent consultant, speaker, and lecturer on ethics, responsibility and sustainability with a specific focus on tech and finance. She started out with a PhD on Corporate Social...

Best Practice
How Will The Explosion of Social Audio Impact B2B Influencer Marketing?
March 9, 2021
All the hype behind social audio apps reminds of 2013-14 when Snapchat first exploded and became mainstream. The rush by users to build connections and create influence was a priority. We saw the...
InterviewsMarketing
Interview with Adrian Swinscoe
March 9, 2021
Described as an experimental CX thought leader and visionary, Adrian Swinscoe is a best-selling author, Forbes contributor, speaker, investor, advisor and aspirant CX Punk.
He has been growing and...

InterviewsFinanceTech
Interview with Ratan Jyoti
March 9, 2021
Ratan Jyoti is a business enabler and advisor to the board. He has demonstrated success devising information security strategies, setting operational standards and governance frameworks, and...

InterviewsTech
Interview with Jason Bloomberg
March 7, 2021
Jason Bloomberg is a leading IT industry analyst, author, keynote speaker, and globally recognized expert on multiple disruptive trends in enterprise technology and digital transformation.
He is...

InterviewsTech
Interview with Tess Hanna
March 6, 2021
Tess Hanna is an editor and writer at Solutions Review covering the Backup and Disaster Recovery, Data Storage, and Business Process Management markets. She has been working in an editorial role as a...

InterviewsTech
Interview with Jos Creese
March 4, 2021
Jos is an independent consultant and analyst, providing advice to public and private sectors on digital and IT strategies, business risk, marketing and customer service. He also undertakes research...

InterviewsFinance
Interview with John Baguley
March 3, 2021
John is Exec Chair of the International Fundraising Consultancy, author of several books including “The Globalization of Non-Governmental Organisations”, a Fellow of the Institute of...

Influencer ListsTech
Who’s Who in Hybrid Cloud?
March 3, 2021
Hybrid Cloud integrates both private and public clouds, enabling tight communication between each distinct cloud. As a result, hybrid cloud functions as one unified infrastructure.
This provides...

Best PracticeGetting StartedMarketing
10 ways to become more influential on Twitter
March 2, 2021
Twitter is the largest microblogging network with more than 330 million monthly active users, which makes it a great platform for spreading your message far and wide and increasing your personal...

InterviewsHealth
Interview with David Chou
March 2, 2021
David Chou serves as the SVP/CIO for a public academic health system. Chou has held executive roles with the Cleveland Clinic, Children's Mercy Hospital, University Of Mississippi Medical Center,...

InterviewsTech
Interview with Mike Barry
February 28, 2021
Mike is a change agent, helping business big and small, new and established to prepare for and succeed in the great sustainability disruption that will wash through the economy in the 2020s. He’s...

InterviewsTech
Interview with Jonathan Armstrong
February 27, 2021
Lawyer helping multinationals with technology, risk and compliance internationally. Regular broadcaster & podcaster with the BBC & other channels. I’ve also written articles on technology,...

InterviewsTech
Interview with Mariela Dabbah
February 25, 2021
Mariela Dabbah is the founder & CEO of the Red Shoe Movement a career and leadership development company powered by a global community of women and men allies who support each other for career...

InterviewsTech
Interview with Dr Danny Kingsley
February 24, 2021
Dr Danny Kingsley is an expert in developing strategy and policy in the higher education and research sector with extensive international experience. She has a particular focus on Open Research and...

InterviewsTech
Interview with Matt Elton
February 23, 2021
Matt has more than 20 years of international experience in the interaction of business and technology, understanding the implications of technology and regulatory change on business strategy, and...

InterviewsTech
Interview with Dana Gardner
February 23, 2021
Dana Gardner is President and Principal Analyst at Interarbor Solutions, an enterprise IT analysis, market research, and consulting firm. Gardner honed his skills and refined his insights as an...

InterviewsTech
Interview with Axel Troike
February 21, 2021
Axel Troike is President at Grandite, Quebec, Canada - the supplier of the SILVERRUN tools for business process and data modeling and provider of related services. With over 20 years of management...

InterviewsTech
Interview with Gero Presser
February 18, 2021
Founder and CEO QuinScape, an IT services company with 175+ employees focused on Data Management and Data Analytics. Computer Scientist (TU Dortmund), PhD in Decision Theory on how to make good...

Influencer ListsTech
Who’s Who in Digital Experience?
February 17, 2021
Digital Experience is, simply put, a multi touchpoint interaction between an organisation and a user that has been made possible with the constant evolution of digital technologies. Digital...
InterviewsTech
Interview with Stewart Bond
February 16, 2021
Stewart Bond is Research Director of IDC’s Data Integration and Intelligence Software service. Mr. Bond's core research coverage includes watching emerging trends that are shaping and changing...

InterviewsTech
Interview with Johannes Drooghaag
February 9, 2021
Promoted in Applied Information Technology, Operations Management and Manufacturing, with vast experience in Operational Technology (OT), Information Technology (IT), Leadership Development and...

InterviewsTech
Interview with Iain Brown Ph.D.
February 4, 2021
Dr. Iain Brown is the Head of Data Science for SAS UK&I and Adjunct Professor of Marketing Analytics at University of Southampton. Over the past decade he has worked across all sectors, providing...
Best PracticeGetting StartedMarketing
10 things you can do to become more influential on LinkedIn
February 3, 2021
LinkedIn is the largest professional networking site in the world with over 303 million active users, 40% of which visit the site daily. Many LinkedIn influencers are followed by team leaders,...
Best Practice
6 Ways COVID-19 has Impacted B2B Influencer Marketing
January 28, 2021
COVID-19 has forced the world to go through a deep digital transformation, with most professionals working remotely, in-person events coming to a standstill and more time being spent at home in front...
Influencer ListsTech
Who’s Who in Data Management?
January 27, 2021
Data is a crucial part of businesses in every industry, which is why data management solutions should be a top priority for any business to ensure that their data is not only easily accessible but is...
InterviewsTech
Interview with Yves Mulkers
January 26, 2021
Yves is a Data strategist, specialised in Data Integration. He has a wide focus on business performance and is a domain expert in Data Management. Yves helps companies build their vision, strategy...

InterviewsTech
Interview with Danilo McGarry
January 19, 2021
Highlights: Current Global Head of Ai & Automation at Alter Domus. Previously Head of Artificial intelligence & Machine Learning at CitiGroup (3rd largest US bank where I started and scaled the...

Influencer ListsTech
Who’s Who in IoT Connectivity?
January 13, 2021
IoT Connectivity classifies any devices connected to the internet using sensors and software to store and exchange data with one another. IoT Connectivity technologies bring the ‘future’ not only...

Influencer ListsTech
Who’s Who in RPA?
December 3, 2020
Our landscape is transforming quickly. Technologies bring new opportunities and new challenges to overcome, which is why we have focused this report on RPA, Robotic Process Automation. More people...

Influencer ListsFinance
Who’s Who in ESG?
November 26, 2020
2020 has been the year that environmental, social and governance criteria shot up the agenda for a wide range of investors. More and more people say they want to invest in businesses that have a...
Influencer ListsTech
Who’s Who in Future of Work?
November 19, 2020
The world of work is transforming quickly, and we all need to become true agents of change if we want to build a brighter future for ourselves and future generations. This requires us to think beyond...
Best PracticeMarketingMarketing Stategy
2020 Research: The Current State & Future of B2B Influencer Marketing
November 17, 2020
We are really excited to announce the launch of our research report on the current state and future of B2B influencer marketing, but from the influencers' perspectives, in partnership with TopRank...
Best PracticeGetting StartedMarketing
What Sets Onalytica’s Customer Success Team Apart
November 10, 2020
Less than 10 years ago, ‘Customer Success’ was a new function that replaced old school account management. Fast forward to today, where all SaaS companies typically need Customer Success teams to...

Influencer ListsTech
Who’s Who in Cybersecurity?
October 15, 2020
Cybersecurity is a necessity in day-to-day life, a study by the Ponemon Institute and Keeper Security has shown that cybersecurity risks are increasing due to prolonged remote working. The report...

InterviewsEmployee Interview
Interview with Nigel Walsh
October 6, 2020
As a Partner, Nigel leads InsurTech and disruptive technology within insurance for the firm. You can hear him regularly on the InsurTech insiders podcast where he co-hosts the show.
He has...

InterviewsEmployee Interview
Interview with Lewis Garrad
September 24, 2020
Lewis is a Partner and business lead for Mercer’s People Science consulting practice. In his role, he applies his training in organizational psychology and experience in the development of data...

InterviewsTech
Interview with Marcell Vollmer
September 24, 2020
Marcell is Partner & Director at BCG with over 20 years of experience developing and implementing procurement, supply chain, and digital transformation strategies across industries globally. Prior to...

Influencer ListsTech
Who’s Who in IIoT?
September 15, 2020
Our landscape is transforming quickly. New technologies bring new opportunities and new challenges to overcome, which is why we have focused this report on IIoT, the Industrial Internet of...
Best PracticeNews
Onalytica Bids Farewell to Influencer Lists as You Know Them
September 10, 2020
Back in 2009 when Onalytica was founded, B2B influencer marketing was in its infancy and still finding its feet. Influencer platforms were few and far between, “influencer” wasn’t in the...

InterviewsTech
Interview with Richard Foster-Fletcher
August 18, 2020
Richard is an Artificial Intelligence (AI) Influencer, Interviewer and Digital Future Podcast Host. He is the Founder of NeuralPath.io, an AI Advisory Practice, Chair of MKAI the AI community in...

Influencer ListsEmployee AdvocacyTech
Part 2 of 2: A Global Study into Tech Employees’ Online Presence & Influence
August 11, 2020
We analyzed 75 Global Tech Firms to discover the employees who have active LinkedIn and Twitter accounts, an audience of over 500 followers and have posted about at least one of the topics listed...

Influencer ListsEmployee AdvocacyTech
Part 1 of 2: A Global Study into Tech Employees’ Online Presence & Influence
July 22, 2020
We analyzed 76 Global Tech Firms to discover the employees who have active LinkedIn and Twitter accounts, an audience of over 500 followers and have posted about at least one of the topics listed...
Best PracticeEmployee Advocacy
5 Characteristics of an Influential Employee
July 14, 2020
There’s a misconception that an influencer has to be an executive, but they don’t always have to be. Leaders are the most time-poor. They also have the least understanding about social media,...

InterviewsEmployee InterviewTech
Interview with Larry Larmeu
July 7, 2020
Enterprise Strategist with experience on both the buy side and sell side. My experience as a leader in both corporate IT and consulting gives me the unique perspective of having defined strategy and...

InterviewsFinance
Interview with Iona Bain
July 2, 2020
Iona Bain is the founder of Young Money Blog and Britain's go-to voice on millennial money. Iona appears frequently on TV and radio, most recently becoming Radio 1's resident Money Hacker, and writes...
Best PracticeEmployee AdvocacyMarketing Stategy
4 Ways Influencer Marketing Impacts Your Pipeline
June 25, 2020
Influencer marketing involves a business working with someone important to their target audience. It evolved out of communications and PR and includes things like analyst relations, blogger...
InterviewsTech
Interview with Ray Wang
June 16, 2020
R “Ray” Wang (pronounced WAHNG) is the Principal Analyst, Founder, and Chairman of Silicon Valley based Constellation Research, Inc. As a leading futurist and authority on business transformation...

Best PracticeEmployee Advocacy
3 Reasons Why Your Expert Employees Unlock Trust and Influence
June 10, 2020
This year, people are going to start moving away from influencer marketing as we know it. Brands are going to be more reluctant to spend money on external influencers to say nice things about them...

InterviewsBusinessEmployee InterviewFinance
Interview with Fabio De Pasquale
June 9, 2020
Architect and UX expert with a great passion for new technologies. Atos Global Manufacturing.

InterviewsTech
Interview with Cathy Hackl
June 4, 2020
Cathy Hackl is a leading female futurist and business strategist specializing in the impact emerging technologies like AR, VR, and AI, are having on communications and business. In 2019 and 2018,...

InterviewsBusinessEmployee InterviewTech
Interview with Aaron Sherwood
June 1, 2020
Aaron Sherwood is the Human X.0 Founder and Industry X.0 Consulting Analyst at Accenture. Aaron is dedicated to the advancement of ethical, next-generation, human-machine augmentation technologies...

Influencer ListsTech
IIoT: Top Influencers
May 21, 2020
From self-driving Trucks and Robotic Supply Chains to every wire, bulb and sensor in a Smart City; the Industrial Internet Of Things industry is at the centre of helping businesses adapt to the...
InterviewsEmployee InterviewFinance
Interview with Cara Williams
May 5, 2020
Cara Williams, is a Senior Partner, based in London, who develops and drives strategy for Mercer’s work with financial intermediaries, wealth management firms and family offices globally. She works...

Best PracticeEventsMarketing Stategy
How to Replicate an Offline Event Experience, Online
April 30, 2020
In-light of the current circumstances, marketers all over the globe are cancelling or postponing their events, and for the bravest of marketers, they're even taking their events online.
Brave, I...

InterviewsEmployee InterviewTech
Interview with Rob McCargow – Director of AI at PwC
April 27, 2020
Rob is an evangelist for the responsible and ethical adoption of AI and advises companies, governments and other global stakeholders on harnessing the opportunities of the technology to drive...
InterviewsTech
Interview with Mark Lynd
April 27, 2020
Mark Lynd (CISSP, ISSAP, ISSMP) is Top ranked global thought leader, author, speaker and practitioner for, AI, Data Center, IoT, IIoT and Cybersecurity. He has been an accomplished enterprise CIO,...

InterviewsTech
Interview with Gaetano Adolfo Maria di Tondo
April 27, 2020
Gaetano is a versatile, energetic and inspirational leader, a passionate communicator, culturally curious, with more than 30 years of deep and broad experience and knowledge in telco and...

InterviewsTech
Interview with Nigel Willson
April 24, 2020
With over 30 years industry experience, Nigel has spent the last 20 years at Microsoft in his last role as European CTO. He is now working independently, as a Speaker, Advisor and Global Influencer...

InterviewsTech
Interview with JC Gaillard
April 24, 2020
JC Gaillard is the Founder and Managing Director of Corix Partners. He is a leading consultant, a senior executive and a team builder with over 25 years of experience developed in several global...

InterviewsTech
Interview with Thomas Power
April 24, 2020
Chairman, Board Member, Board Advisor to six organisations, Board Member at 9 Spokes PLC New Zealand (ASX Sydney), Bloomberg Listed PLC Director (Tradus PLC, 9Spokes PLC), Mastermind Groups with...

InterviewsEducationTech
Interview with Dr. Ian McAndrew
April 23, 2020
I am a Mechanical Engineer by background, my qualifications are a Bachelor's, Master's and a PhD as a chartered engineer. Then I also did another degree and qualified as an electrical engineer. I...

Influencer ListsEmployee Advocacy
A Global Study into Consultancy Employees’ Online Presence & Influence
April 21, 2020
Given the nature of what consultancies do and the services that they provide, there is a real need to demonstrate their expertise and thought leadership on social media. Employees are the perfect...

InterviewsMarketingTech
Interview with Danielle Guzman
April 21, 2020
Danielle Guzman is the Global Head of Social Media for Mercer. She is a seasoned financial services and insurance industry professional with rich experience in leadership positions spanning product...
InterviewsTech
Interview with Kirk Borne
April 20, 2020
I am currently the Principal Data Scientist, Data Science Fellow, and Executive Advisor at Booz Allen Hamilton. I have been with the company since 2015. Before that I was a Professor of Astrophysics...
InterviewsMarketingTech
Interview with Katie King
April 17, 2020
Katie King is a published Author, Keynote Speaker and Consultant on Artificial Intelligence (AI) and digital/business transformation. Katie has over 30 years’ of consulting experience and has...

Influencer ListsFinance
Top Financial Services Professionals Discussing COVID-19
April 9, 2020
The old adage “When America sneezes, the world catches a cold” may seem to be the height of irony, but the impact Coronavirus has had on the world’s economy is truly unprecedented. With Over 10...

InterviewsMarketingTech
Interview with Ryan Bares
April 8, 2020
I've been at IBM and in the influencer space since 2016 and I sit within the IBM Systems business unit. IBM is obviously a very huge enterprise and we're divided into a dozen or so different business...

Best PracticeNews
Introducing “Podium” – a Global, Immersive, Virtual Events Solution
April 8, 2020
In the last 8 weeks the world has gone through unprecedented changes that have completely turned the corporate world on its head. Businesses have had no choice but to transition into remote working...

InterviewsBusinessTech
Interview with Giuliano Liguori
April 6, 2020
Digital Transformation Advisor, Giuliano Liguori is Founder and CEO of the consulting firm GLweb.eu, specialized in the application of Digital Transformation and Industry 4.0 paradigms. With...

InterviewsTech
Interview with Helene Li
April 3, 2020
A seasoned finance industry professional with long tenures in leadership positions at global financial institutions like JPMorgan and BNP Paribas, Helene is a firm believer in applying capital market...

Influencer ListsTech
3D Printing: Top Influencers
March 31, 2020
While CNC machines and manufacturing have been around since the 1950's, 3D printing burst onto the consumer scene in 2012, and while the Star Trek Replicator isn’t ready quite yet, there is a large...

InterviewsTech
Interview with Jo Peterson
March 27, 2020
Jo is the VP of Cloud Services for Clarify360, an IT consultancy focused on strategic sourcing. An engineer by trade, Jo partners with organizations to navigate the complex cloud, network, and...

InterviewsTech
Interview with Buck Woody
March 27, 2020
Buck Woody works on the Azure Data Services team at Microsoft, and uses data and technology to solve business and science problems. With over 35 years of professional and practical experience in...

Influencer ListsMarketing
Remote Working: Top Influencers and Brands
March 26, 2020
With the world in flux and businesses adapting as quickly as they can to new environments, remote working has been the solution for many.
But with the dramatic changes that businesses have...

InterviewsTech
Interview with Ludmila Morozova-Buss
March 25, 2020
I have started on my studies towards my Doctorate that will be in Quantum Computing at Capitol Technology University, USA. A doctoral researcher since January 2020, my resume is something less than a...

InterviewsTech
Interview with Tim Spann
March 19, 2020
Tim Spann is a Senior Solutions Engineer at Hortonworks, the Big Data Zone leader and blogger at DZone and an experienced data engineer with 15 years of experience. He runs the Future of Data...

InterviewsTech
Interview with Robert Hirschfeld
March 19, 2020
Rob has been creating software to automate infrastructure for over 20 years. His latest startup, RackN, focuses on providing continuously integrated data center capabilities for both Edge and...

InterviewsTech
Interview with Nicolas Babin
March 19, 2020
Agile senior executive with over 30 years international, multilingual and multicultural experience. Proven track records in management, marketing, sales, communication & digital transformation. Set...

InterviewsTech
Interview with Dr Mark van Rijmenam
March 19, 2020
Dr Mark van Rijmenam is the author of three best-selling management books on big data, blockchain and AI. His latest book – The Organisation of Tomorrow – details how AI, blockchain and analytics...

InterviewsTech
Interview with Linda Grasso
March 19, 2020
Linda is Chief Operating Officer at Digital Business Innovation Srl, an Italian Innovative Startup active in the world of R&D Consulting. She’s an Industrial Engineer passionate in Digital...

InterviewsEnvironment
Interview with James Lloyd
March 19, 2020
James leads an international multi-sectorial campaign to elevate the profile of natural climate solutions at Nature4Climate. He promotes the role of natural and regenerative solutions that are...

InterviewsTech
Interview with Lori MacVittie
March 18, 2020
Lori Mac Vittie is a technologist and principal evangelist in F5 Networks’ Office of the CTO with an emphasis on emerging architectures and technologies including cloud and edge computing, network...

InterviewsTech
Interview with Helen Yu
March 18, 2020
Helen Yu believes real growth thrives at the crossroads of #tech and #humanity. There, she contends, is where customer loyalty and love thrive. In her former role as Chief Customer Officer, Ms. Yu...

InterviewsTech
Interview with Tony Flath
March 18, 2020
Driven by passion and curiosity I’ve always been interested in technology, especially emerging technology. I was fortunate to have been an early adopter of cloud computing and have been staying on...

Influencer ListsHealth
Coronavirus: Top Healthcare Professionals
March 17, 2020
Since December 1st, there have been 264 million Tweets around the Coronavirus, and the numbers are still growing. We’re still only at the beginning of this upheaval. Healthcare organizations need...

InterviewsTech
Interview with Richard Seroter
March 13, 2020
Richard Seroter is a Senior Director at VMware, with a master’s degree in Engineering from the University of Colorado. He’s also a 12-time Microsoft MVP for cloud, Pluralsight trainer, lead...

InterviewsTech
Interview with Thomas Harrer
March 13, 2020
Thomas Harrer is Chief Technology Officer for IBM Systems Hardware Sales Europe. He helps clients across Europe to evolve their infrastructure architecture. He is an advocate known for his forward...

InterviewsGovernmentTech
Interview with Chuck Brooks
March 12, 2020
Chuck Brooks a globally recognized thought leader for Cybersecurity and Emerging Technologies. He is President of Brooks Consulting International and an Adjunct Faculty at Georgetown University in...

InterviewsMarketingTech
Interview with Chloe Jones
March 11, 2020
Chloe is part of Lenovo’s communications team. Her mission is to identify fans of the brand and create engaging programmes which brings Lenovo closer to this highly motivated and engaged group of...

Influencer ListsTech
Big Data: Top Influencers and Brands
March 11, 2020
Since the printing press broke onto the scene in the 15th Century, the amount of data we produce has been increasing dramatically. Through a rocky last decade, Big Data as an industry has finally...
InterviewsMarketingTech
Interview with Laura Mackey
March 6, 2020
My role is Global Influencer Marketing Manager for HPE and that means, at the worldwide level, I manage our influencer strategy and execution for influencer marketing activities. So it's my job to...
Influencer ListsTech
Facial Recognition: Top Influencers and Institutes
March 5, 2020
In 1966, MIT professor Marvin Minsky hired his undergraduate student Gerald Sussman for a simple summer job. To link a camera to a computer and make it say what it saw.
More than 50 years later...

InterviewsEnergy
Interview with Thomas Hillig
February 28, 2020
Thomas Hillig graduated with a PhD in Business Administration. He comes from a consulting background and worked at Alstom Power in the strategy department. He has also worked as a VP Sales and...

InterviewsTech
Interview with Mike Kail
February 21, 2020
Mike D. Kail is the CTO at Everest.org, where he is responsible for the FinTech Cloud Platform and Engineering Teams. Previously, he served as Yahoo's CIO and SVP of Infrastructure and as VP of IT...

Influencer ListsFinanceTech
Fintech Top 100 Influencers
February 20, 2020
With the initial Fintech boom over our shoulders, we’re now starting to see something interesting happening in the market, Fintech’s boom is beginning to come to fruition. Given the $4.7+...
InterviewsFinance
Interview with Bryan Clagett
February 20, 2020
Bryan is on the StrategyCorps executive team and singularly focused on driving revenue growth through new initiatives that help financial services organizations and fintech become ever more relevant...

InterviewsMarketingTech
Interview with Rani Mani
February 20, 2020
Rani is the Head of Global Employee Advocacy at Adobe. She is passionate about cultivating and nurturing communities and coaching others to do the same. She is currently working across Adobe teams to...
InterviewsMarketing
Interview with Christoph Trappe
February 14, 2020
Christoph helps companies share their unique stories more efficiently to reach prospects and retain existing customers. He has run content marketing campaigns across many industries, including...
InterviewsMarketing
Interview with Jeff Davis
February 14, 2020
Jeff Davis, an international keynote speaker, business consultant, and author of the award-winning book “Create Togetherness” specializes in helping B2B revenue leaders transform the way they...
InterviewsCharity
Interview with Rhodri Davies
February 13, 2020
Rhodri Davies is Head of Policy at Charities Aid Foundation (CAF), and leads Giving Thought – CAF’s in-house think tank focussing on current and future issues affecting civil society. He is the...

Influencer ListsTech
Top 100: Cloud Influencers
February 4, 2020
For many, Cloud Technology has become part of their everyday language. There are 13,149 influencers driving the conversation around Cloud online, and in 2019 there were 32.5 million social media...
Best PracticeEmployee AdvocacyInfluencer ActivationMarketing Stategy
Expert Predictions on What 2020 Holds for Influencer Marketing
January 16, 2020
2019 was a big year for influencer marketing, with endless influencer scandals and groundbreaking social media & technology platform developments, everywhere you turned, there was an influencer...

InterviewsCharity
Interview with Jen Bokoff
January 8, 2020
Jen Bokoff is the director of stakeholder engagement at Candid (formerly Foundation Center + GuideStar). She develops partnerships, communications, and insights that power the work of the...
InterviewsTech
Interview with Kevin O’Donovan
December 18, 2019
Kevin has been evangelizing how new technologies can transform the way we do things through-out his career, having established a proven track record of 'bridging the gap' between the capabilities a...

InterviewsFinance
Interview with Sonia Wedrychowicz
December 17, 2019
Sonia Wedrychowicz is a thought leader in Digital Banking and Technology Transformation, with 25 years of experience in financial services and technology. She has worked in major banking...
InterviewsTech
Interview with Tim Crawford
December 16, 2019
Tim Crawford is ranked as one of the Top 100 Most Influential Chief Information Technology Officers (#4), Top 100 Most Social CIOs (#7), Top 20 People Most Retweeted by IT Leaders (#5) and Top 100...

Best PracticeMarketing StategyMeasuring Success
How to Write a Business Case That Your Boss Will Say Yes to
December 5, 2019
Writing a concise yet thorough business case is of paramount importance when you need to get internal buy-in and sign off from your senior managers. This is especially true for a relatively new and...

Influencer ListsEnvironmentEvents
COP 25 – Key Topics and Influencers Shaping the Climate Change Debate
December 3, 2019
This week, the 25th UNFCCC Conference of the Parties begins in Madrid.
Once a year, almost every nation in the world, along with thousands of observing and participating institutions, from NGOs &...

InterviewsMarketing
Interview with Mariska Kesteloo
November 29, 2019
Entrepreneur, public speaker and Past-President of Meetings Professional International in Belgium. With more than 15 years working experience in tourism and the MICE (Meetings, Incentives,...

InterviewsCharity
Interview with Simon Scriver
November 25, 2019
Simon Scriver is a professional fundraising consultant, coach, trainer, practitioner, keynote speaker, podcast host and co-founder of the virtual conference Fundraising Everywhere.
Simon has won...

InterviewsCharity
Interview with Howard Lake
November 25, 2019
Howard Lake is a digital fundraising entrepreneur. He has published UK Fundraising, the world’s first web resource for charity fundraisers, since 1994 and wrote the world's first book on the...

Influencer ListsFinance
Women In Finance: Top 100 Influencers
November 21, 2019
Within modern society we tend to forget that women have been at the heart of the financial world throughout history. So much so, that words we use today such as money, monetise and mint are all...

Best PracticeMarketing Stategy
5 Skills That The Top 1% of Marketers Nail
November 20, 2019
Do you ever find yourself scrolling through LinkedIn, noticing the marketers that seem to be absolutely smashing it? The ones that always seem on the ball with the latest news and trends, are well...
Best PracticeInfluencer ActivationMarketing Stategy
How to Create an Influencer Marketing Strategy That Will Get You Results in 12 Weeks
November 14, 2019
Influencer marketing strategy is arguably the most important, yet neglected piece of the puzzle when it comes to a successful influencer program.
Influencer Marketing is on most marketers' radars...

Influencer ListsHealthTech
Top 100 Pharma & Biotech: Start-ups and Influencers Changing Drug Discovery and Development
November 6, 2019
For this Top 100, we’ve identified the most influential pharma & biotech professionals talking about topics such as drug discovery, R&D, Biotech start-ups, investment and regulation; helping to...

InterviewsTech
Interview with Avrohom Gottheil
November 4, 2019
Avrohom Gottheil is the founder of #AskTheCEO Media, where he helps businesses get heard over the noise on social media, by translating their corporate messages into language people...

Influencer ListsEnergyTech
Industry Report: Smart Grids & Beyond
October 23, 2019
Smart Grids are coming. With the Energy Transition in full swing, bringing the infrastructure and technology we use to keep the lights on into the 21st Century has never been more important. With...
Best PracticeInfluencer ActivationInfluencer DiscoveryMarketing StategyMeasuring Success
[eBook] The Complete Guide to Industry & B2B Influencer Marketing
October 16, 2019
We are very excited to announce that we have launched an updated Complete Guide to Industry & B2B Influencer Marketing. Influencer marketing is at a stage where it is no longer a "nice to have", but...

InterviewsMarketing
Interview with Ollie Brazier
September 27, 2019
I currently run Oxygen Media, a performance, results driven digital marketing agency based in Auckland, New Zealand. We have a small dedicated team of digital strategists driven to help and grow our...
InterviewsMarketing
Interview with Ted Rubin
September 27, 2019
Ted Rubin is a leading Social Marketing Strategist, Photofy CMO, Author/Speaker/Provocateur. Ted was Chief Social Marketing Officer of Collective Bia and a principal shareholder until the November...

InterviewsHealthTech
Interview with João Bocas
September 26, 2019
João Bocas is an expert in wearable technology and is a globally recognized business thought leader, mentor, advisor, and entrepreneur. His passion lies in helping others, sharing experiences,...

Influencer ListsTech
Top 100: Smart Grid Influencers
September 24, 2019
The demand for power is undoubtedly increasing, whether that's home chargers for electric cars, or Alexa reading out recipes in your kitchen, we need power. The odd thing is, that the current power...
Influencer ListsEnvironment
Climate Change and Nature-based Solutions: Top 30 Influencers and Brands
September 19, 2019
We are experiencing a climate crisis. Everywhere you look there is news of more extreme weather events, occurring with higher frequency and intensity as our world heats up, displacing millions and...

InterviewsMarketing
Interview with Matthew Woodward
September 18, 2019
Matthew Woodward runs an award-winning SEO blog that publishes detailed case studies and tutorials that focus on helping people to build and run a successful online business. He started his blog in...

InterviewsFinance
Interview with Jim Marous
September 6, 2019
Named as one of the most influential people in banking and a top 5 financial services and artificial intelligence influencer to follow, Jim Marous is an internationally recognized industry futurist,...

Influencer ListsCharity
Top 100: Charity Industry Influencers
September 3, 2019
With the arrival of social media and the speed at which information can now be shared and received, the list of charitable causes seems to have grown exponentially. For each injustice in the world...

InterviewsFinance
Interview with Jochen Heussner
August 30, 2019
I am the founder of www.planetcompliance.com, a leading platform for analysis and insights on financial regulation and innovation. I also write regularly in different formats and speak at,...
InterviewsFinance
Interview with Alex Jiménez
August 29, 2019
Alex is Chief Strategy Officer at Extractable, a strategic consulting, design and data analytics agency focused on the future of financial services. Extractable consults exclusively with financial...

Influencer ListsEnvironment
Consumer Goods and Environmental Sustainability: Top Brands and Influencers
August 14, 2019
The number of obstacles facing retailers and FMCG brands is bigger than ever. From global warming and plastic pollution to ethical supply chains, deforestation and biodiversity, the list keeps...

Best PracticeMarketing Stategy
Build Your Influencer Marketing Strategy in 5 Minutes
August 9, 2019
To mark the launch of our Influencer Marketing Academy we’ve created an interactive tool to help marketing & PR professionals to create their influencer strategy in just 5 minutes. We’d love for...
InterviewsTech
Interview with Alvin Foo
August 8, 2019
A senior technology and media executive, Alvin brings more than 20 years of experience in the Asia Pacific across agencies and tech companies with the last 13 years spent in China. As Managing...
InterviewsFinance
Interview with Nasir Zubairi
August 8, 2019
Nasir is CEO of The Luxembourg House of Financial Technology (LHoFT), a public/private sector initiative to drive fintech innovation in Luxembourg. He is also a Non-Executive Board Director of...
InterviewsTech
Interview with Kevin L. Jackson
August 7, 2019
Kevin L. Jackson is a globally recognized cybersecurity and cloud computing expert. Cited as a “Top 5G Influencer” and “Top 20 Tech Blogger”, he provides digital transformation, education and...

Influencer ListsFinanceTech
RegTech: Top 100 Influencers
July 23, 2019
Why is RegTech so hot right now? Is it the fact that it can save teams a great number of man-hours? Or possibly that with new and challenging regulatory concerns tied up with the constant emphasis on...
InterviewsFinance
Interview with Olus Kayacan
July 23, 2019
I have the pleasure to work within Institutional Banking, Financial Services and Technology since 22 years and participated to the launch and development of several businesses. I have a solid...

Best PracticeNewsPublic Sector
Onalytica are an official UK Government G-Cloud Supplier!
July 22, 2019
Onalytica are proud to announce that we are an official UK Government G-Cloud Supplier. This means that we are eligible to supply our award winning influencer marketing software and professional...

InterviewsFinance
Interview with Conor Coughlan
July 22, 2019
I am senior business professional with over 20 years of experience in the Banking, Technology, Financial Services & Insurance (BFSI) sectors. I am currently a Chief Marketing Officer for a Global...

Influencer ListsEnvironmentFinance
FinServ & Environmental Sustainability: Top 40 Influencers
July 3, 2019
The second blog in our sustainability miniseries focuses on the FinServ sector. Sustainability risks are now business risks, and as such, are being discussed throughout all sectors and levels of...

InterviewsFinance
Interview with Xavier Gomez
July 3, 2019
Xavier Gomez is founder & COO of INVYO, data management marketplace. INVYO company that uses machine learning and Natural Language Processing (NLP) to help financial institutions see tomorrow's...
InterviewsMarketingTech
Interview with Rich Simmonds
June 27, 2019
Author, Disruptive Influencer. Consistently recognised as one of the Top20 Digital Marketing Influencers in the world for over 5 years. Rich is a dynamic facilitator capable of asking the different...
Influencer ListsEnvironmentTech
Tech and Environmental Sustainability: Top 40 Influencers
June 26, 2019
Technology is a driving force when it comes to environmental sustainability and with it we're able to further our efforts to find new ways of saving energy and being greener as a whole. Satellites...
InterviewsTech
Interview with Samiran Ghosh
June 24, 2019
In a career spanning 25 years, Samiran has held key roles at Microsoft, Dun & Bradstreet, IBM and TCS. Some of the senior leadership positions he has held recently are Chief Digital Advisor at...
Influencer ListsEnvironment
Climate Crisis & Environmental Solutions: Top Brands and Key Influencers Helping to Solve the Problem
June 18, 2019
Climate change is, and should be a current global concern, however it’s only recently been labelled a ‘crisis’. This change in name has led to an increase in global conversations surrounding...

InterviewsTech
Interview with Enrico Molinari
June 13, 2019
Enrico Molinari is a game changer and innovation marketing manager. He is University Professor in economics & fintech, omnichannel marketing management and digital communications strategies. He was...

Influencer ListsEnvironment
Environmental Sustainability: Top 100 Influencers
June 12, 2019
Environmental sustainability is the balancing act of regulating society's needs with environmental needs. Onalytica's research shows that over half of the online environmental sustainability...

Influencer ListsTech
5G: Top 100 Influencers
May 30, 2019
It’s on the tip of everyone's tongue at the moment, you can almost sense it in the air, something’s coming. Here we are, eagerly awaiting the arrival of 5G. Bringing with it a new era of speed....
Best PracticeEmployee AdvocacyMeasuring Success
How to Measure Employee Advocacy With Metrics That Actually Matter
May 16, 2019
Despite clear statistics telling us that the modern buyer’s journey has changed, making audiences more receptive to value-add content than sales content, a large proportion of B2B employees and...
InterviewsFinance
Interview with April Rudin
May 13, 2019
Founder and President of The Rudin Group, April J. Rudin is widely acknowledged as a top marketing strategist for the financial-services and wealth-management sectors. Distinguished by her ability to...

Best PracticeEmployee Advocacy
30 Expert Quotes Demonstrating The Power of Employee Advocacy
May 2, 2019
Back in October last year we published an Employee Advocacy guide, taking marketers through exactly how they can reap maximum benefits by integrating their employee advocacy, influencer marketing and...
InterviewsCharity
Interview with Fields Jackson
April 30, 2019
Fields Jackson, Jr. is currently the Founder , CEO and Chief Cheerleader of Racing Toward Diversity Magazine, Cary, NC, Executive Director of the HBCU Business Dean Roundtable and Coordinator of...

InterviewsFinanceTech
Interview with Marija Butkovic
April 29, 2019
Marija Butkovic is digital marketing and business consultant, public speaker, startup mentor and blogger who has worked across a range of projects in different industry sectors, including legal,...

InterviewsFinanceTech
Interview with Theodora Lau
April 24, 2019
Theodora (Theo) Lau is speaker, writer, and advisor, whose work seeks to spark innovation to improve consumer financial well-being and health. As founder of Unconventional Ventures, she focuses on...

InterviewsCharity
Interview with Debra Ruh
April 23, 2019
Debra Ruh is a Global Disability Inclusion Strategist, Digital Inclusion, Market Influencer, SDGs, Impact Investing, Gender Equity and internationally recognized keynote speaker, published author,...
Best PracticeEmployee Advocacy
The Employee Advocacy Magic Question: “What’s in it For Me?”
April 18, 2019
A couple of weeks ago we took a look at the three main reasons why employees object to joining an employee advocacy program. To recap, these were:
They are not sure what content they are allowed...

Influencer ListsEnergyEnvironment
Renewables and Future of Energy: Top 100 Influencers
April 17, 2019
Ideas have varied when it comes to facing climate issues, from space solar panels to floating cities, there’s no shortage of futuristic visions. Nevertheless, the world is currently transitioning...

Best PracticeInfluencer ActivationSEO
Are Influencers Key to Your SEO Success?
April 16, 2019
SEO is something that us marketers of small, large and everything in-between organizations, both love and fear. According to HubSpot, up to 90% of traffic originates from search engines, and 64% use...
Best PracticeInfluencer Activation
5 Questions you Should ask Before Paying an Influencer
April 9, 2019
*This post was written by guest blogger, Philip Peters, Head of Social & Paid Media at Travelport.*
The debate around whether you should pay influencers in B2B marketing is nothing new. Here’s why...

Best PracticeEmployee Advocacy
What’s Stopping Employees From Engaging On Social Media?
April 4, 2019
One of the biggest hurdles getting in the way of a successful employee advocacy program, is the employees' desire and apprehension to join. Often, there will be employees that just simply do not want...
Best PracticeEmployee Advocacy
Why Employee Advocacy is More Than Just an Intranet
March 28, 2019
The phrase "employee advocacy" conjures a lot of thoughts in the minds of the marketers. It can raise the prospect of having to rely on colleagues to be the conduit for the messages you've spent...

InterviewsTech
Interview with Joanne Moretti
March 27, 2019
With 30+ Years in the High Tech Industry, serving as an executive in Chief Marketing Officer roles, Sales GM roles as well as full P&L roles, at various Fortune 500 companies, Joanne is a world-class...

Best PracticeNews
Onalytica Named MarTech Vendor of the Year
March 26, 2019
We are very proud and honoured to have been named MarTech Vendor of the Year at this year's B2B Marketing 2019 Martech Awards. We would like to take this moment to acknowledge our incredible team at...

Best PracticeInfluencer ActivationInfluencer DiscoveryMarketing Stategy
Influencer Marketing: A Week in the Life Supporting an Influencer Marketer
March 21, 2019
MONDAY
I have a meeting with a client visiting us from the US first thing in the morning, we don't get to see each other that often so it’s pretty exciting. We talk about the reporting...
InterviewsEducation
Interview with Greg Jenkins
March 21, 2019
Greg Jenkins is a dedicated and passionate leader, facilitator, coach and mentor dedicated to helping people and teams achieve higher levels of performance. Greg completed a successful 28+ year US...

Influencer ListsFinance
Wealth Management: Top 100 Influencers
March 20, 2019
WHAT IS WEALTH MANAGEMENT AND WHY IS THE MARKET CHANGING?
Wealth Management incorporates financial planning, investment portfolio management and a number of aggregated financial services. Wealth...

Influencer ListsEventsTech
Cybersecurity: Top 100 Influencers at RSA Conference 2019
March 14, 2019
The Ever-Growing Global Importance of Cybersecurity
Cybersecurity risks are growing in frequency and scale. At $600 billion, the global cost of cybercrime has reached 0.8% of the world’s GDP,...
Best PracticeEmployee AdvocacyInfluencer ActivationInfluencer Discovery
Why You Should Integrate Influencer Marketing & Employee Advocacy in 2019
March 13, 2019
Employee advocacy, social selling and influencer marketing are becoming increasingly popular and common strategies for brands to reach and share content with their target audience. However, they are...
Influencer ListsEvents
International Women’s Day – Top 100 Influencers on Gender Equality and Diversity
March 8, 2019
WHAT IS INTERNATIONAL WOMEN’S DAY AND WHERE DID IT ALL START?
International Women’s Day (IWD) gets more and more attention every year, particularly now that social media has become so crucial in...

Best PracticeMeasuring SuccessTech
How do Influencers Impact the Media Agenda in AI?
February 28, 2019
Artificial Intelligence: what is it? How will it impact our lives? How will it be used? Will it actually take over? As the field emerges and becomes more widely discussed, social media’s role in...

Influencer ListsHealth
Digital Disruption in US Healthcare: US Influencer Insights
February 27, 2019
American consumers want more convenient, digitally accessible healthcare and technology is the way to get there. Improving technologies such as wearables gives people the ability to track their...

Best PracticeEmployee Advocacy
Can Employee Advocacy Drive Sales?
February 14, 2019
Trust in branded content is decreasing, all while trust in people is increasing. With this said, many organizations seem yet to realize that one of their most powerful trust facilitators and sales...
Best PracticeGetting Started
10 Questions to ask When Buying an Influencer Marketing Platform
February 12, 2019
2019 is yet another big year for influencer marketing. As influencer marketing continues to grow in awareness and popularity, both supply and demand for influencer marketing platforms is continually...
InterviewsTech
Interview with Rob McCargow
February 4, 2019
Rob works with partners across academia, government, technology vendors, start-ups, and other key stakeholders, in order to drive innovation within PwC and develop new services for clients. He is an...

Influencer ListsFinance
Digital Innovation Within the US Banking Influencer Community
January 30, 2019
Whilst challenger banks haven’t been as big a hit in the US as they have in the UK and across Europe, they are certainly making themselves known. What’s more interesting is that the successful...
InterviewsFinance
Interview with David Jimenez Maireles
January 30, 2019
David Jiménez Maireles is Country Head of Spain at Raisin. He heads up Raisin’s business in Spain, to lead marketing, and growth efforts and forging key partnerships with fintech companies and...

InterviewsTech
Interview with Vladimer Botsvadze
January 24, 2019
Vladimer Botsvadze is a globally renowned, multi award-winning, digital transformation and social media influencer, Fortune 500 consultant, thought leader, professor, keynote speaker and TV...

Influencer ListsFinance
Digital Innovation Within the UK Banking Influencer Community
January 10, 2019
Two-thirds of bank branches in the UK have closed in the past 30 years. Customers are choosing mobile apps and businesses are investing heavily in digital. Banks need an online presence to survive...

InterviewsMarketing
Interview with Brian Hansford
January 8, 2019
I’m VP of Marketing Performance at Heinz Marketing, where I’ve worked the last 6 ½ years. I’m focused on helping B2B marketers improve revenue performance, communicate results with executive...
InterviewsTech
Interview with Joanna Young
December 21, 2018
Joanna Young has executive-level experience in CIO and CFO positions, with a proven track record providing digital leadership and guidance to executives, teams, and individuals from the Fortune 100...

InterviewsTech
Interview with Jos Creese
December 20, 2018
With over 30 years IT leadership experience, Jos has held a variety of CIO roles and non-executive director positions. He is a recognised independent analyst and researcher, Past President of the...

InterviewsTech
Interview with Dean Johnson
December 14, 2018
As an accomplished Design, Technology and Innovation Consultant at Activrightbrain, Writer, Presenter, Host, Futurologist and BBC tech pundit, Dean Johnson is shaping the connected future for Film,...
Best PracticeInfluencer ActivationInfluencer DiscoveryMarketing StategyMeasuring Success
An Evaluation of Brand Influencer Partnerships
December 13, 2018
We are very excited to announce that we have published An Evaluation of Brand Influencer Partnerships: Understanding Motivations, Challenges and Aligning Goals. This is a new market research study...
InterviewsFinance
Interview with Stuart Wilson
November 27, 2018
I have spent the last 30 years working in financial services, mostly in B2B roles and for a range of big and small brands from Friends Provident to LV= and Just Retirement. I have also run my own...

Influencer ListsTech
The Future of Recruitment: Top 100 Influencers
November 26, 2018
As businesses become more global and technological advances in AI and automation change the way we work, so does the landscape of recruitment. Whereas in the past most workers had largely...
Best PracticeMarketing Stategy
Influencer Marketing Tips Going Into 2019
November 22, 2018
Yesterday we hosted our fourth Influencer Marketing Huddle event, gathering senior marketing and PR professionals from B2C, B2B and Not-for-profit brands to bounce ideas and experiences off each...

Best PracticeEmployee Advocacy
How to Help Your Employees Become Influencers
November 15, 2018
The concept of your employees being influencers may sound odd to some. When most hear the term 'influencer' they think of the social media influencers on platforms such as Instagram, Twitter and...
InterviewsEdTech
Interview with Sylvia Duckworth
November 13, 2018
Sylvia Duckworth is an award-winning Canadian educator with more than 30 years teaching experience in the public and private systems. Her mantra is “Connect, Collaborate, Create” and she is...
Best PracticeB2BEmployee Advocacy
Is Employee Advocacy Just for B2B?
November 12, 2018
There's no denying that the attributes of a B2B buyer differ greatly from a B2C consumer's. B2B buyer journeys are much longer and more complex with a higher average purchase price, compared to buyer...

Best PracticeEmployee Advocacy
5 Reasons Why Your Employees Should be on Social Media
November 1, 2018
Brands' need and desire to effectively communicate with their employees has always been hot on their agenda. But the way in which brands have approached this has evolved a lot over the years. Brands...
InterviewsMarketing
Interview with Robert Levin
October 30, 2018
Rob is the CEO and Editor-in-Chief of content development firm RSL Media, specialising in helping enterprise companies achieve their revenue goals through exceptional buyer-aligned content programs...

Best PracticeEmployee Advocacy
Employee Advocacy 2.0
October 11, 2018
We are very excited to announce that just over a year on, we are publishing yet another guide book - this time on Employee Advocacy. Back in August last year we published our Definitive Guide to...

InterviewsMarketing
Interview with Andy Crestodina
October 1, 2018
Andy Crestodina is a co-founder and Chief Marketing Officer of Orbit Media, an award-winning 38-person web design company in Chicago. Over the past 18 years, Andy has given digital marketing advice...
InterviewsTech
Interview with William McKnight
September 7, 2018
William functions as Strategist, Lead Enterprise Information Architect, and Program Manager for organizations worldwide making data into a key asset. He has worked with and advised many of the...

InterviewsMarketing
Interview with Jamil Ahmed
September 7, 2018
CEO @Reinforce Lab – Your Digital Growth Partner ¦ Pharmacist ¦ Extensive Traveler ¦ Helping Entrepreneurs to grow Personal Brand ¦ Building strategy and executing plans for Small Businesses to...

InterviewsTech
Interview with Joel Backaler
September 3, 2018
Joel Backaler is a global marketing strategist, author, and international keynote. He is a Managing Director at Frontier Strategy Group, and his thought leadership has been featured in Forbes, BBC,...
InterviewsFinance
Interview with Charlotte Halkett
August 29, 2018
Charlotte is MD Insurance Product at buzzvault, a radical new insurtech proposition offering the world’s first truly intelligent, personalised home insurance based on a digital catalogue of...
InterviewsFinance
Interview with Prajit Nanu
August 29, 2018
My name is Prajit Nanu. I am Co-founder and CEO at InstaReM, Asia-Pacific’s leading digital cross-border payments company, where we help individuals, SMEs and financial institutions to transfer...

InterviewsTech
Interview with Rick van der Lans
August 29, 2018
Rick van der Lans is a highly-respected independent analyst, consultant, author, and internationally acclaimed lecturer specializing in data warehousing, business intelligence, big data, and database...

InterviewsTech
Interview with Sarah-Jayne Gratton
August 23, 2018
Dr Sarah-Jayne Gratton is a global brand influencer who has worked with brands across the world to build both their professional and social capital. She is a member of the Siemens Influencer...

Influencer ListsHealth
Obesity, Diabetes & the Sugar Problem: Top Influencers Brands & Publications
August 9, 2018
Obesity occurs when energy intake from food or drink consumption is greater than the energy expenditure through metabolism or exercise. The World Health Organisation has stated that obesity has...
InterviewsTech
Interview with Shailendra Kumar
August 8, 2018
Shailendra is a keynote speaker, influencer and a thought-leader in the Artificial Intelligence space . With an experience of over 23 years working with Corporates, Software Vendors and Consulting...
InterviewsTech
Interview with Chris Webb
August 8, 2018
Chris is an experienced consultant and trainer specializing in the Microsoft BI stack and in particular Power BI,SQL Server Analysis Services, MDX, DAX, M, Power Pivot and Power Query. He’s been...
InterviewsMarketing
Interview with Timothy Snow
August 7, 2018
Top 3 LinkedIn Brand Ambassador / Brand Influencer w/ Verizon, Motorola and HTC. Currently Social Media Director / Content Marketing Strategist at G Media Studios. Talent Management / Promotions...
InterviewsTech
Interview with Wayne Eckerson
August 7, 2018
Wayne Eckerson is an internationally recognized thought leader in the business intelligence and analytics field. Wayne has been a thought leader in the business intelligence and analytics field since...
InterviewsTech
Interview with Brian Moran
August 7, 2018
Brian has spent the last 20+ years helping America’s entrepreneurs realize their dreams. Prior to starting his 3rd company in 2012, he was the Executive Director of Sales Development at the Wall...
InterviewsTech
Interview with Arjen van Berkum
July 30, 2018
Arjen van Berkum is a Dutch national and is involved in analytics, big data and machine learning from the year 2002 and onward. First in marketing intelligence and database marketing but moving on to...

Best PracticeHealthInfluencer Activation
Giving Pharmaceuticals an Influencer Health Kick
July 26, 2018
TLDR:
Pharmaceutical and Health Sciences Brands are shying away from running effective influencer programs
Regulatory hurdles mean sharing content and mobilising influencers becomes a...
Influencer ListsEducationTech
STEM: Top Influencers, Brands and Publications
July 25, 2018
STEM (Science, Technology, Engineering, and Mathematics) is a term used to group together these academic disciplines, typically used when addressing education policy and curriculum choices in...
InterviewsTech
Interview with Dean Anthony Gratton
July 20, 2018
Dr Dean Anthony Gratton is a technology futurist and influencer. He has worked extensively within the wireless communications R&D industry where his wireless research work has been patented. Dean is...
Best PracticeMarketing Stategy
#TwitterPurge – a Much Needed Shake up for Influencer Marketing?
July 19, 2018
Over the last 12 months, Twitter have been upping their effort to combat the issue of fake accounts and 'malicious' automated activity, since it came to light that Russia were using the platform to...
InterviewsMarketing
Interview with Sandeep Raut
July 19, 2018
Sandeep is Digital Transformation, Analytics, Big data, IoT & Mobility evangelist with over 30 years of experience in IT Consulting and delivery.

InterviewsMarketing
Interview with Tony Baer
July 18, 2018
One of Ovum’s most visible analysts, Tony Baer is a recognized authority in extending data management practices, governance, and analytics to address Big Data. He has established two new research...

InterviewsTech
Interview with Philip Seamark
July 17, 2018
Philip Seamark a senior BI architect, author and Microsoft data platform MVP with more than 25 years of commercial experience delivering business applications across multiple technologies. He is an...
InterviewsMarketing
Interview with Adam Saxton
July 17, 2018
Adam Saxton is just a guy in a cube doing the work! Having worked with Microsoft Business Intelligence products since 2005, he mainly focuses on Power BI and Analysis Services now. He is based in...

InterviewsMarketing
Interview with Jonathan Aufray
July 17, 2018
Jonathan Aufray is the co-founder and CEO at Growth Hackers. He helps startups, SMBs and fellow entrepreneurs grow with growth hacking and digital marketing. In the past 15 years, he has lived in 7...

Best PracticeB2BEventsMarketing Stategy
Key Takeaways from attending 7 Talks at B2B Ignite 2018
July 16, 2018
B2B Ignite 2018 took place on 10th July at the Business Design Centre in Islington. This year was the biggest yet with 1200 people in attendance from Marketing Managers through to C-Suite and B2B...

Influencer ListsEnvironment
Sustainability: Top Influencers, Brands and Publications
July 11, 2018
For professionals in the global sustainability world, building and leveraging influence is about scaling positive impact. Time is of the essence in this field, so being more visible and 'vocal'...

InterviewsTech
Interview with John P. White
July 2, 2018
John P White is the Chief Technical Officer and Co-Founder of UnlimitedViz, the makers of tyGraph. He holds a Master’s degree in Engineering from the University of Guelph and has been a Microsoft...
InterviewsTech
Interview with Hyoun Park
June 25, 2018
Hyoun Park is the CEO and Founder of Amalgam Insights, an industry analyst firm focused on managing technology at scale for emerging business models. Over the past 20+ years, Park has been at the...

Best PracticeInfluencer Discovery
Weeding Out Influencers Who Buy Fake Followers
June 25, 2018
Weeding Out Influencers Who Buy Fake Followers - What Needs To Happen Next? - Part 1
There’s been a lot of coverage and discussion in the last week about Unilever’s decision to stop working with...
InterviewsTech
Interview with Tamara Dull
June 22, 2018
“If you can’t explain it simply, you don’t understand it well enough.” This Einstein quotes reminds me that complexity is hard, but simplicity is even harder. I have always loved the...

InterviewsTech
Interview with Merv Adrian
June 20, 2018
With over three decades of experience in IT, from programming to marketing and strategy, to IT market analysis, to research executive, Mr. Adrian now focuses on helping IT users and vendors be more...

InterviewsTech
Interview with Ronald Van Loon
June 15, 2018
Top 10 Global AI, Machine Learning, IoT, 5G, Big Data, Predictive Analytics, Data Science Influencer. Director of data and analytics consultancy firm, Intelligent World, and course advisor for...
Influencer ListsB2C
Top 100 Most Influential UK and US Mummy Bloggers
June 13, 2018
Mummy bloggers continue to command dedicated followings in their millions, and the main reason for this is readers appreciate the honesty and authenticity of their posts. A real mother, blogging...
InterviewsTech
Interview with Ganapathi Pulipaka
June 12, 2018
Dr. Ganapathi Pulipaka is the CEO, Chief Data Officer, Chief Data Scientist, and SAP Technical Lead of DeepSingularity LLC, a premier SAP and artificial intelligence consulting firm. He is also a...
InterviewsTech
Interview with Antonio Grasso
June 7, 2018
Antonio Grasso, who started out as a developer and software architect in the IT industry, has led large projects for the Italian government. Antonio is the founder and CEO of Digital Business...

Influencer ListsTech
Business Intelligence: Top Influencers, Brands and Publications
June 6, 2018
Business intelligence (BI) refers to technologies, applications, infrastructure, tools and best practices for the collection, integration, analysis, and presentation of business information to...
InterviewsMarketing
Interview with Lillian Pierson, P.E.
May 29, 2018
Lillian Pierson is a Data Strategist that specializes in training and advising. She’s a licensed Professional Engineer in the State of Florida, with 6 years of experience working as a data...

InterviewsMarketing
Interview with Carme Artigas
May 25, 2018
Carme Artigas is the co-Founder and CEO at Synergic Partners, a company that specializes in Big Data that was acquired by Telefónica in 2015. Carme Artigas has more than 20 years of experience in...

Influencer ListsFinance
FinTech 2018: Hot Topics and Top Influencers
May 21, 2018
FinTech is a relatively new industry applying technology to improve financial activities. FinTech companies consist of both startups and established financial and technology companies trying to...
InterviewsMarketing
Interview with Shep Hyken
May 16, 2018
Shep Hyken, CSP, CPAE is the CAO (Chief Amazement Officer) of Shepard Presentations. As a customer service expert and keynote speaker, Shep works with companies who want to build loyal relationships...

Best PracticeInfluencer ActivationInfluencer DiscoveryMarketing StategyMeasuring Success
How Many Influencers Should You Work With for Maximum Success?
May 3, 2018
A common topic on people's minds when starting out an influencer program is around the optimal number of influencers that they should be working with in order to achieve results. And it's a good...
Best PracticeInfluencer ActivationInfluencer DiscoveryMeasuring Success
What are the Experts Saying About Influencer Marketing?
April 26, 2018
Last week we hosted our third Influencer Marketing Huddle event, gathering senior marketers from B2C, B2B and Not-for-profit brands to bounce ideas and experiences off each other, listen to brand &...

Best PracticeInfluencer Activation
How to Guarantee Content Shares From Influencers
April 19, 2018
What is a content marketer's ultimate dream? To increase brand awareness, establish brand perception and to increase demand generation - often using content performance metrics such as views, social...
Influencer ListsTech
Data Science: Top 100 Influencers, Brands and Publications
April 18, 2018
Data science is the science of extracting knowledge or insights from data in various forms. From finance, to marketing, tech to energy, data science is used in every industry. At the heart of...

InterviewsMarketing
Interview with Andy Crestodina
April 5, 2018
Andy Crestodina is a co-founder and Chief Marketing Officer of Orbit Media, an award-winning 38-person web design company in Chicago. Over the past 18 years, Andy has given digital marketing advice...

InterviewsMarketing
Interview with Nikhil Jain
April 3, 2018
Hi, I am Nikhil Jain, a “ResearchPreneur” – an Entrepreneur with research as his core interest to solve more complex problems and to build solutions for masses. I am a PhD student in...
Best PracticeInfluencer Activation
Do you Really Need to pay Influencers?
April 3, 2018
What do you think of when you hear 'influencer marketing'? Do you immediately think of celebrities posting paid-for Instagram posts showcasing consumer products accompanied with #ad? Or do you think...
InterviewsMarketing
Interview with Dan Gingiss
March 29, 2018
Dan’s 20-year career has consistently focused on delighting customers, spanning multiple disciplines including social media, customer service, marketing, and digital customer experience.
Dan is the...
Influencer ListsEnvironment
Tackling Plastic Pollution: Top 100 Influencers, Brands and Publications
March 26, 2018
Plastic has only been around for 60-70 years but it's already begun to negatively impact the natural environment and create problems for plants, wildlife and even human population. As plastic is...
InterviewsMarketing
Interview with Lilach Bullock
March 16, 2018
Highly regarded on the world speaker circuit, Lilach has graced Forbes and Number 10 Downing Street. She’s a hugely connected and highly influential entrepreneur. She is listed in Forbes as one...

InterviewsMarketing
Interview with Mike Allton
March 15, 2018
Mike is an award-winning blogger, speaker, and author at The Social Media Hat, and Brand Evangelist at Agorapulse where he strengthens relationships with social media educators, influencers and...

Best PracticeInfluencer Activation
Influencers are People, NOT Campaigns
March 12, 2018
As we're all well aware by now, things have changed. No longer do brands have the power over the market place, the consumers do; consumers are no longer influenced directly by the brands themselves,...
Influencer ListsTech
Digital Transformation: Top 100 Influencers, Brands and Publications
March 7, 2018
Digital transformation is the term given to the transformation of business activities, processes and models to fully leverage the opportunities of new digital technologies. The aim of integrating...
InterviewsTech
Interview with Bill Mew
March 2, 2018
I’ve always worked in the tech sector, focusing on problem solving and complex communications. Initially this was as a Weapons Engineering Office in the Royal Navy and then as an executive at the...

InterviewsTech
Interview with Ann Cavoukian
March 2, 2018
Appointed as the Information and Privacy Commissioner of Ontario, Canada in 1997, Dr. Ann Cavoukian served for an unprecedented three terms as Commissioner. In that time, she elevated the Office of...
Influencer ListsEventsMarketing
#SMMW18: Top Influencers to engage with ahead of the conference
February 28, 2018
Social Media Marketing World is the premier event for all social media marketers. This year it's taking place in San Diego from Wednesday February 28th to Friday, March 2nd, 2018. It provides a...

InterviewsFinance
Interview with Martin Bamford
February 23, 2018
Martin is a Chartered Financial Planner, Fellow of the Personal Finance Society and SOLLA Accredited Later Life Adviser at Informed Choice, the award-winning firm of Chartered Financial Planners in...
InterviewsEnergy
Interview with Mark Z. Jacobson
February 22, 2018
Mark Z. Jacobson is Director of the Atmosphere/Energy Program and Professor of Civil and Environmental Engineering at Stanford University. He is also a Senior Fellow of the Woods Institute for the...

InterviewsEnergy
Interview with Taylor Kuykendall
February 22, 2018
Taylor Kuykendall is a journalist interested in energy, science, policies, and politics. He researches a variety of news topics on coal companies covered by S&P Global Market Intelligence. He is...

Influencer ListsTech
Top Influential Developers in AI, Cloud, Cybersecurity, IoT and VR / AR / MR
February 21, 2018
Software Developers invent technology that we use every day, but may take for granted, like checking our bank balance on our phones, booking a meeting in our personal calendars, listening to music or...
InterviewsEnergy
Interview with Daniel Cohan
February 16, 2018
Associate Professor of Environmental Engineering at Rice University focusing on atmospheric modeling to inform air quality management and the impacts of energy use on the environment and health....
InterviewsEnergy
Interview with Kees van der Leun
February 14, 2018
All round dedicated sustainable energy expert with 30 years of experience in the field: consultant, business developer, manager, strategist. Renewable energy, energy efficiency, carbon emission...
InterviewsMarketing
Interview with Tiffani Bova
February 13, 2018
Tiffani Bova is the global customer growth and innovation evangelist at Salesforce. Recognized in 2014 as one of the most Powerful and Influential Women in California by the National Diversity...

Influencer ListsEnergy
The Future of Energy: Top 100 Influencers, Brands and Publications
February 7, 2018
The bulk of the world's energy mix is made up by fossil fuels (coal, oil and gas). These fossil fuels produce carbon dioxide and other greenhouse gases which are the fundamental driver of climate...

Best PracticeInfluencer Discovery
Are Your Influencers Buying Their Followers?
January 30, 2018
The New York Times recently published an article called: "The Follower Factory" exploring the growing demand for purchasing fake followers and engagement across social media platforms.
The article...
InterviewsTech
Interview with Carolina Rudinschi
January 30, 2018
Carolina Rudinschi, Ph.D. is the Co-founder of IIoT-World.com, the first Global Digital Media Outlet dedicated 100% to Connected Industry, Industrial Internet of Things, Industry 4.0. In less than...
InterviewsFinance
Interview with Elizabeth Lumley
January 29, 2018
Liz Lumley is a global specialist commentator on global financial technology or ‘FinTech’. She has spent over 20 years working in the financial technology space, most recently as Managing...
InterviewsTech
Interview with Caroline Wong
January 25, 2018
Caroline Wong is the Vice President of Security Strategy at Cobalt. Caroline’s close and practical information security knowledge stems from broad experience as a Cigital consultant, a Symantec...

InterviewsTech
Interview with Sarah Hill
January 25, 2018
Immersive media entrepreneur at the intersection of virtual reality, story, neurofeedback, and spirituality. National Edward R. Murrow, NAB Service to America and 12 time mid-America Emmy...

InterviewsTech
Interview with Alicia Asín
January 23, 2018
Alicia Asín is CEO and co-founder of Libelium, a Spanish IT company which designs and manufactures technological solutions for smart cities and the Internet of Things (IoT).
She is a computer...
InterviewsTech
Interview with Nuria Oliver
January 19, 2018
Nuria Oliver, is Director of Research in Data Science at Vodafone, Chief Data Scientist at Data-Pop Alliance and Chief Scientific Advisor at the Vodafone Institute. She has over 20 years of...
InterviewsTech
Interview with Lisa Seacat DeLuca
January 19, 2018
Lisa Seacat DeLuca is a Distinguished Engineer for IBM Watson Internet of Things where she leads a team called the App Factory, focused on bringing IoT use cases to market. Lisa holds a Masters of...
InterviewsFinance
Interview with Dorota Zimnoch
January 18, 2018
Dorota Zimnoch is an international fintech and insurtech expert and the Top50 global influencer. As a founder of Zing Business Consulting, Ms. Zimnoch advises corporate boards in the financial...
InterviewsMarketing
Interview with Moni Oloyede
January 18, 2018
Moni is a Marketing Operations specialist with 10 years of Marketing Technology experience. She has worked with all the major marketing automation companies – Marketo, Eloqua, HubSpot, and...

Best PracticeInfluencer Activation
Influencer Marketing: The Power of the "Micro-Moment"
January 17, 2018
A micro-moment (a term first introduced by Google in 2015) is the eureka moment in marketing and advertising in which the penny drops for the consumer; the moment they choose to enter the buying...
InterviewsFinance
Interview with Devie Mohan
January 15, 2018
Devie is a fintech marketing strategy and research professional with years of experience working with industry giants and startups. She has worked in strategy, marketing and analysis roles in firms...
InterviewsMarketing
Interview with Cory Munchbach
January 12, 2018
Cory Munchbach is the senior vice president of strategy at BlueConic, the world’s simplest and most accessible customer data platform, empowering every marketer to find success with a CDP. Prior to...

InterviewsMarketing
Interview with Maxine Mackintosh
January 11, 2018
Maxine is a researcher working at the intersection of data science and dementia at University College London. Her PhD involves mining medical records for new predictors for dementia. She is...
InterviewsFinance
Interview with Penny Crosman
January 10, 2018
Penny Crosman is Editor at Large at American Banker. Prior to taking on this role, she was Editor in Chief of Bank Technology News and Technology Editor of American Banker. She has held senior...
InterviewsMarketing
Interview with Sujan Patel
January 5, 2018
Sujan Patel is the co-founder of Web Profits, a growth marketing agency helping companies leverage the latest and greatest marketing strategy to fuel their businesses. Sujan has over 13 years of...

InterviewsFinance
Interview with Christina Kehl
January 4, 2018
Christina Kehl co-founded SWISS FINANCE STARTUPS (SFS), Switzerland’s first association of fintech startups, in 2014 while she was COO at Knip AG. Knip is the first mobile-based insurance broker...

Best PracticeInfluencer Activation
7 Ways you can Engage with Your Influencers
December 14, 2017
Influencer engagement is the most challenging part of Influencer Relationship Management. It requires a PR culture of building 1-to-1 relationships with a marketing activation of scaling engagement...
InterviewsMarketing
Interview with Mari Smith
December 13, 2017
Mari Smith is often referred to as the “Queen of Facebook” and is widely recognized as one of the world’s foremost experts on Facebook marketing. She is a Forbes’ top Social Media Power...

InterviewsMarketing
Interview with Rachel Miller
December 11, 2017
Rachel has over 15 years of experience in marketing with expertise in social media marketing, content marketing, and influencer marketing. Her social strategy has achieved global recognition working...
InterviewsMarketing
Interview with Mark Schaefer
December 11, 2017
Mark W. Schaefer is a globally-recognized blogger, speaker, educator, consultant, and author who blogs at businessesgrow.com — one of the top marketing blogs of the world. As Executive Director...
Best PracticeMarketing Stategy
5 Things to Do Now to Prepare For Influencer Marketing in 2018
December 7, 2017
It seems like just yesterday that we were packing up 2016 and placing our bets on what 2017 had in store, and here we are preparing for 2018 - scary, huh?
Once we muster the ability to look beyond...

Influencer ListsTech
Women in Tech: Hot Topics and Top Influencers
December 6, 2017
When we say tech, what do you first think of? Young men squirreling away in a dark room surrounded by half eaten pizzas, lit only by flickering lines of code – an army of wannabe Mark Zuckerbergs...
InterviewsTech
Interview with Daniel Newman
November 24, 2017
Daniel Newman works with the world’s largest technology brands exploring digital transformation and how it is influencing the enterprise. His work has appeared in leading media outlets around the...

Best PracticeEmployee Advocacy
5 Top Tips to Get Your Senior Execs on Social Media
November 22, 2017
When it comes to being social, a business has to start with its leaders. At Tribal Impact, it’s our mission to increase employee advocacy in a way that really adds value to businesses. But this new...

InterviewsMarketing
Interview with Melonie Dodaro
November 21, 2017
Melonie Dodaro is the author of the #1 international bestseller, The LinkedIn Code. She’s a highly sought after speaker and trainer that specializes in social selling (digital sales and...
InterviewsSales
Interview with Tim Hughes
November 20, 2017
Tim Hughes is universally recognised as one of the world’s leading pioneers and exponents of Social Selling and he is currently ranked Number 1 as the most influential social selling person in...

InterviewsEnergyEnvironment
Interview with Andrea Learned
November 14, 2017
I’m an independent communications strategist specialising in digital content and social media engagement in the sustainability and climate action space, with an emphasis on influencer relations....

InterviewsMarketing
Interview with Sam Hurley
November 7, 2017
Sam Hurley is a lateral-thinking, people-focused digital marketer — holding solid experience in both agency and client-side settings. He now runs his own global personal branding and influencer...
InterviewsMarketing
Interview with Daniel Knowlton
November 6, 2017
Dan is a Top #100 Digital Marketing Influencer and international speaker who went from knowing nothing about Digital Marketing, to growing an award-winning, 6 figure Digital Marketing Agency with his...
InterviewsTech
Interview with Bill Schmarzo
November 3, 2017
Bill is the CTO of Dell EMC’s Big Data and IOT Consulting Practice. He is also an Executive Fellow at the University of San Francisco School of Management. Bill has over three decades of...
Best PracticeMarketing Stategy
Key Takeaways From our Influencer Marketing Huddle Workshop
November 2, 2017
Yesterday, we co-hosted our second Influencer Marketing Huddle workshop with OST Marketing here in London. As the name suggests, it's a practical, hands-on event where we gather senior B2B and B2C...
InterviewsMarketing
Interview with Jasmine Sandler
November 1, 2017
Jasmine Sandler, a Keynote Speaker on Social Branding for Entrepreneurs and Executives is the Founder and CEO of Agent-cy Online Marketing, an Online Branding Agency and Global Digital Marketing...
InterviewsEdTech
Interview with Matt Miller
October 30, 2017
Matt Miller is an educator, blogger and presenter from West Central Indiana. He has infused technology and innovative teaching methods in his classes for more than 10 years. He is the author of the...

Best PracticeInfluencer ActivationInfluencer DiscoveryMarketing Stategy
14 Influencer Marketing Pearls of Wisdom
October 26, 2017
Back in August, we published a pretty awesome white paper: The Definitive Practical Guide to Influencer Relationship Management. We brought together industry experts from marketers to the...

InterviewsTech
Interview with Shira Rubinoff
October 25, 2017
Shira Rubinoff has been President of two cybersecurity firms, and consults to start-ups, helping them grow and succeed. She is on the Boards of the Executive Women’s Forum and Leading Women in...

InterviewsTech
Interview with Ian Moyse
October 24, 2017
Ian Moyse is Sales Director at Cloud Telephony provider Natterbox and Onalytica #1 Social influencer in Cloud 2017. He was awarded Sales Director of the Year by the Institute of Sales Management...
InterviewsTech
Interview with Sam Watts
October 23, 2017
Sam has 15+ years of experience in web & software development, e-learning and the online games industry, the majority of which were in a team and/or project management position. He is currently very...

InterviewsFinance
Interview with Sébastien Meunier
October 19, 2017
Sébastien has a successful track of defining business strategies and leading global transformations in Financial Institutions (from Business Lines to IT / Operations and Transverse functions). He is...

InterviewsTech
Interview with Jeffrey Bradbury
October 18, 2017
Jeffrey Bradbury, author of Kidblog: An Introduction to Blogging With Your Students, is the creator of TeacherCast.net, TeacherCast University, and Educational Podcasting Today. He is an ASCD...
InterviewsFinance
Interview with Bernard Moon
October 17, 2017
Bernard Moon is a Co-founder & Partner at SparkLabs Group, a network of startup accelerators and venture capital funds. Previously, Bernard was a Managing Director at the Lunsford Group, which is a...

InterviewsHealth
Interview with Robert Lustig
October 17, 2017
Robert Lustig is Professor emeritus of Pediatrics, Division of Endocrinology at the University of California, San Francisco (UCSF). He specializes in the field of neuroendocrinology, with an emphasis...
InterviewsEdTech
Interview with Thomas C. Murray
October 16, 2017
Thomas C. Murray serves as the Director of Innovation for Future Ready Schools at the Alliance for Excellent Education located in Washington, DC. He has testified before the United States Congress...
InterviewsParent Blogging
Interview with Maggy Woodley
October 13, 2017
Maggy Woodley started the popular Easy Crafts for Kids blog www.redtedart.com 7 years ago. Since then she has create an amazing resource of child friendly crafts for all the family to enjoy. The...
Best PracticeMarketing Stategy
Just how Mature is the Influencer Marketing Industry?
October 11, 2017
Let’s take a leap back in time to 2015.
Back then, as we adjusted to Instagram’s meteoric rise and coped with paid social becoming the norm, all while Mark Ronson’s Uptown Funk played...

InterviewsEdTech
Interview with Mike Tholfsen
October 10, 2017
Mike Tholfsen is a Principal Product Manager on the Microsoft Education team focusing on OneNote Class and Staff Notebooks, Learning Tools and Microsoft Teams. He is a 22 year veteran at Microsoft...
InterviewsEdTech
Interview with Jaime Casap
October 9, 2017
Jaime Casap is the Education Evangelist at Google. Jaime evangelizes the power and potential of technology and the web as enabling and supporting tools in pursuit of promoting inquiry-driven...
InterviewsTech
Interview with Tamara McCleary
October 6, 2017
Tamara McCleary is the CEO of Thulium, a marketing and digital consulting agency specialising in social media brand amplification, influencer marketing, and thought leadership.
As an internationally...
Best PracticeMeasuring Success
How to Measure Influencer Marketing Success and ROI
October 4, 2017
Measuring the success and ROI (return on investment) of marketing in general has been notoriously difficult. The whole point of marketing is to evoke action in your target audience. The very reason...

Influencer ListsTech
VR 2017: Top 100 Influencers, Brands and Publications
October 4, 2017
2016 was a pivotal year for the virtual reality industry, with almost 100 million VR units shipped worldwide. We analysed the conversation back then in this blog post, and we wanted to revisit the...

InterviewsEdTech
Interview with Monica Burns
September 29, 2017
Dr. Monica Burns is an Curriculum and EdTech Consultant, Apple Distinguished Educator and Founder of ClassTechTips.com. As an educator, Monica was part of her school’s Federal Magnet Funding...

InterviewsTech
Interview with Brian Solis
September 29, 2017
Brian Solis is the Principal Analyst and futurist at Altimeter, a Prophet Company, a keynote speaker and best-selling author. Brian studies disruptive technology and its impact on business and...
Best PracticeInfluencer Activation
How to Nail Your Influencer Engagement
September 27, 2017
Getting influencer marketing right all lies on nailing your influencer engagement. We know where our target audience are being influenced, so now it's time to start engaging with influencers on these...

InterviewsTech
Interview with Bernard Marr
September 26, 2017
Bernard Marr is an internationally best-selling business author, keynote speaker and strategic adviser to companies and governments. He is one of the world’s most highly respected experts when it...
InterviewsEdTech
Interview with Kerry Gallagher
September 26, 2017
Kerry Gallagher is a Digital Learning Specialist at St. John’s Prep in Danvers, Massachusetts. She is also Director of K-12 Education for ConnectSafely, a non-profit based in Silicon Valley...

InterviewsMarketing
Interview with Mark Fidelman
September 22, 2017
Mark Fidelman is the CEO for Fanatics Media, a Full Service Digital Marketing Agency with a focus on B2B and B2C Influencer marketing. Mark has been named a 2016 Top 20 influencer of CMOs by Forbes...
InterviewsMarketing
Interview with Zontee Hou
September 21, 2017
Zontee Hou is the founder & president of Brooklyn-based consultancy Media Volery and co-lead of the respected Convince & Convert Consulting team. Her 10+ years of work in the marketing industry...

Best PracticeInfluencer ActivationMarketing Stategy
Where are Your Target Audience Being Influenced?
September 20, 2017
Finally, we've reached a point in our influencer marketing blog post series where we can really start getting to it- for the lack of a better phrase.
We know what influener marketing is, why...

InterviewsHealth
Interview with John Nosta
September 19, 2017
John Nosta was recently named as the number one influencer in health tech. He is a THINKER focused on the world of SCIENCE, MEDICINE and INNOVATION. He is regarded as one of the top global...

InterviewsFinance
Interview with Spiros Margaris
September 18, 2017
Spiros Margaris is a Venture Capitalist and Thought Leader in the FinTech and InsurTech scenes. He is ranked No. 1 FinTech and No. 2 InsurTech global influencer by Onalytica, and he...
InterviewsMarketing
Interview with Doug Kessler
September 18, 2017
Doug Kessler is co-founder and creative director of Velocity Partners, the London- and New York-based B2B marketing agency (and the CMA Agency of the Year 2016). Doug has written a lot about content...

InterviewsFinance
Interview with Oliver Bussmann
September 15, 2017
Oliver is a Senior Technology Executive with 25+years of influential leadership in different industries (High Tech and Financial Service) with UBS, SAP, Allianz, Deutsche Bank, and IBM. He is a...
InterviewsMarketing
Interview with Neal Schaffer
September 15, 2017
Neal Schaffer is a leading consultant, educator, speaker, innovator, and influencer at guiding businesses through their digital transformation with a focus on social selling, social media marketing,...
InterviewsTech
Interview with Bill McCabe
September 14, 2017
Bill McCabe spent his early career as a CPA with a major accounting firm. What he learned from accounting is that he didn’t want to spend his whole life doing it. That knowledge engendered a...
InterviewsMarketing
Interview with Ann Handley
September 14, 2017
As the world’s first Chief Content Officer, Ann Handley speaks and writes about how you can rethink the way your business markets. Cited in Forbes as the most influential woman in Social Media and...

Best PracticeInfluencer Discovery
How to Identify Your Target Influencers
September 12, 2017
Last week, we covered how you can outline your influencer marketing strategy. This week we take you through how you can identify your influencers, as per our Definitive Practical Guide to Influencer...

InterviewsFinance
Interview with Ron Shevlin
September 11, 2017
Ron Shevlin leads research at Cornerstone Advisors including the Cornerstone Performance Report and the Insight Vault. Cited often in the industry press, Ron is the author of Smarter Bank and a...

Best PracticeMarketing Stategy
How to Create Your Influencer Marketing Strategy
September 6, 2017
Last month, I co-authored a white paper called The Definitive Practical Guide to Influencer Relationship Management.
So far we’ve covered what influencer marketing is and why you should be...
Influencer ListsMarketing
Content Marketing 2017: Top 200 Global Influencers
September 5, 2017
With Content Marketing World 2017 happening this week in Cleveland, Ohio we analyzed the social and blog conversations around ‘Content Marketing’ from January 2017 to look at the most hotly...

InterviewsTech
Interview with Alexandra Deschamps-Sonsino
September 4, 2017
Alexandra is an internet of things consultant with an interaction & product design background. She is also the founder of the Good Night Lamp, a family of internet-connected lamps for your global...

InterviewsMarketing
Interview with Michael Brenner
August 31, 2017
Michael Brenner is a globally-recognised keynote speaker, author of The Content Formula and the CEO of Marketing Insider Group. He has worked in leadership positions in sales and marketing for...
InterviewsMarketing
Interview with Lee Odden
August 30, 2017
As an agency CEO, Lee is actively developing new marketing offerings, strategies and advancing thought leadership on content marketing, influencer marketing, social media marketing, SEO, and a...
Best PracticeMarketing Stategy
How to Define Your Influencer Marketing Objectives
August 30, 2017
Here we are. Week two of our educational series around The Definitive Practical Guide to Influencer Relationship Management.
Last week we covered the what and why and this week we're going to...
InterviewsTech
Interview with James Whittaker
August 29, 2017
James Whittaker’s career spans academia, start-ups and top tech companies and starts in 1986 as the first computer science graduate hired by the FBI. James then worked as a freelance developer,...
Best PracticeMarketing Stategy
What is Influencer Marketing and why Should you be Doing it?
August 23, 2017
Last week we published our white paper called The Definitive Practical Guide to Influencer Relationship Management.
First thing's first- what does the white paper cover?
This guide is both...

Best PracticeInfluencer ActivationInfluencer DiscoveryMarketing Stategy
White Paper: The Definitive Practical Guide to IRM
August 17, 2017
We're excited to announce that we've published The Definitive Practical Guide to Influencer Relationship Management. We brought together industry experts from marketers to the influencers...
InterviewsHealth
Interview with Nick van Terheyden
August 16, 2017
Dr. Nick is a leader in Digital Healthcare and Innovation and former Chief Medical Officer for Dell. He provides strategic insights and guidance to support healthcare organisations, medical...

InterviewsHealth
Interview with Brian Ahier
August 14, 2017
Brian Ahier is a nationally recognized health IT worker with a deep understanding of the technical and policy considerations focus on data exchange, population health, and analytics. He is a Digital...

InterviewsHealth
Interview with Brennan Spiegel, MD, MSHS
August 14, 2017
Brennan Spiegel, MD, MSHS directs the Cedars-Sinai Center for Outcomes Research and Education (CS-CORE), a multidisciplinary team that investigates how digital health technologies – including...
InterviewsHealth
Interview with Jane Sarasohn-Kahn
August 14, 2017
Jane is a health economist, advisor and trend-weaver supporting organizations at the intersection of health, technology and people. Jane founded THINK-Health after working for ten years with health...
InterviewsHealth
Interview with Evan Kirstel
August 14, 2017
Social Business had been a healthy “obsession” for years, as I’ve grown my Twitter (138K followers) and LinkedIn (15K connections) networks, while helping dozens of clients grow from zero...

InterviewsHealth
Interview with Denise Silber
August 4, 2017
Driven by a passion to use new technologies to improve healthcare for patients and professionals, Denise founded Basil Strategies communications consultancy and the Doctors 2.0 & You conference...

InterviewsHealth
Interview with Mike Feibus
August 3, 2017
Mike Feibus (pronounced FY-bus) is a well-recognized and oft-quoted expert on connected health and fitness, augmented reality/virtual reality, and privacy and security. He is also a regular...

Influencer ListsHealthTech
HealthTech: Top 100 Influencers, Brands and Publications
June 29, 2017
The digital revolution has catalysed many changes in the way society functions, these range from instant news alerts to virtual reality gaming. The rise of technology has also boosted the healthcare...

Influencer ListsTech
IOT 2017: Top 100 Influencers, Brands and Publications
June 8, 2017
With the latest Amazon Echo advertising campaign dominating our TV screens it is hard to ignore the rise of smart appliances. These appliances fall under the category the Internet of Things (IoT)....

Influencer ListsTech
AI 2017: Top 100 Influencers, Brands and Publications
May 25, 2017
Artificial intelligence - or AI - is a true part of our world, as well as a substantial hub of interest for science and business. Companies are ferociously investing in, engaging in and including...

Best PracticeInfluencer Activation
How to get on Your Influencers’ Radars
May 10, 2017
As an industry, we're forever going on about why you should be doing influencer marketing- hopefully we're well on our way to convincing you all, since 84% of marketers are planning at least one...
Influencer ListsTech
Big Data 2017: Top 100 Influencers and Brands
May 9, 2017
Big data analytics is the process of examining large and varied data sets to uncover hidden patterns, unknown correlations, market trends, customer preferences and other useful information that can...
Best PracticeMarketing Stategy
PPC V Influencer Marketing; Clicks V Sales
May 5, 2017
Marketing as a business function seamlessly combines both creative and strategic thinking; creative because to stand out against your competitors, you must strike the right balance between achieving...

Influencer ListsFinanceTech
IFGS 2017: Top 100 Influencers and Brands
April 24, 2017
Now in its third year, the Innovate Finance Global Summit has become one of the most important global FinTech events to attend in London. This year, the conference gained a second day, dedicated to...

Best PracticeEmployee Advocacy
Are you Leveraging Your Employees’ Influence?
April 20, 2017
Depending on how familiar you are with influencer marketing or influencer relations, it may or may not come as a surprise that under its umbrella comes brand advocacy, too. A brand advocate is...
Best PracticeMarketing Stategy
How to Use Influencer Marketing at a Fast-Growth Startup
April 11, 2017
As a growth hacking digital marketer in the funded startup world, I regularly see the hustle-filled journey from startup inception to market-conquering results. If a genuine product market fit is...
Best PracticeMarketing Stategy
Influencer Marketing Vs Influencer Relations- What’s the Difference?
April 6, 2017
Influencer marketing this; influencer relations that- we’re hearing both terms being thrown around an awful lot across social media, sometimes interchangeably, sometimes with entirely different...
Influencer ListsEventsMarketing
#SMMW17: Hot Topics and Top Influencers
April 4, 2017
Social Media Marketing World 2017 (SMMW17) was a wonderful event where over 200 speakers and over 3000 attendees from over 50 different countries around the world descended on San Diego to create a...

Influencer ListsEnergyEnvironment
Women4Climate: Forging Relationships and Amplifying Impact
March 27, 2017
As I’ve mentioned in previous posts both here on Onalytica’s blog and on my own blog, events can be powerful milestones around which to map your Twitter influence and engagement strategy. But...
Best PracticeMarketing Stategy
Which Department Owns Influencer Marketing?
March 23, 2017
Influencer marketing will play a significant role in brands’ 2017 marketing and communication strategies, with 84% of marketers saying they will launch at least one influencer campaign within the...

Best PracticeMarketing Stategy
3 Biggest Things to Remember for Influencer Marketing in 2017
March 22, 2017
This is a joint piece I co-wrote with Felix Morgan, Senior Strategist & Innovation lead at our Partner, Livity, following our youth influencer event #UseYourInfluence on March 8th 2017.
With...
Influencer ListsTech
Cloud: Top 100 Influencers and Brands for 2017
March 20, 2017
Cloud computing is a model for delivering IT services in which resources are retrieved from the internet through web-based tools and applications rather than a direct connection to a...

Best PracticeMarketing Stategy
10 Tips for Selling in Influencer Marketing to Senior Management
March 17, 2017
Back in January we published a post on the '5 Most Common Reasons why Influencer Marketing Fails', identifying "lack of understanding from senior management" as a prevalent reason. In order to even...

Best PracticeMarketing Stategy
Competitors Want you out, Influencers Want you in
March 16, 2017
“We don’t have any competitors.”
I’ve heard this often. My response is: if you don’t have competitors then your business idea is either so bad no one will touch it (possible), or so great...

Influencer ListsB2C
Retail Fashion: Top 300 Influencers, Brands and Publications
March 14, 2017
Retail fashion makes up a large section of the consumer good market. It is a market which is typically distinguished by rapid shifts in consumer demand, a large number of competitors and brief...

Influencer ListsEnergyEnvironment
Renewable Energy & #Women4Climate – What’s the Connection?
March 13, 2017
During Womens’ History Month, and in the days before the first ever #women4climate event (convened by @C40Cities), we took a look at the influencers in the broader climate action and energy...
Best PracticeMarketing Stategy
Influencer Marketing: Truth or Myth?
March 9, 2017
Influencer marketing is a relatively new concept; with new concepts comes scepticism and criticism- fuel for misinformed opinions and sweeping statements. For every person that gets influencer...

Best PracticeEmployee Advocacy
Why Every CEO Should Have a Social Media Presence
March 1, 2017
We live in a technology obsessed society where your average millennial's reality blurs into one with their virtual online world; posting anything and everything from their latest fashion purchases,...

Influencer ListsHealth
NHS Influencers: Who are they and what are they saying?
February 27, 2017
In 2015-16 the NHS employed around 1.6 million people with a combined budget of £136.7 billion. As the NHS is funded by British tax payers it is a real political hot potato, and the debate about how...

Best PracticeInfluencer ActivationMeasuring Success
5 Ways to Drive the Success of Influencer Relations
February 22, 2017
Last month we published a blog post entitled '5 Most Common Reasons why Influencer Marketing Fails'. Now, while we are confident that this article was helpful in pinpointing exactly where brands...

Influencer ListsB2C
Sponsors at the Super Bowl 51: Top 100 Influencers and Brands
February 17, 2017
Sunday 5th February 2017 saw one of the biggest sporting events in the world take place; the Super Bowl, where the New England Patriots took on the Atlanta Falcons at the NRG Stadium, in...

Best PracticeInfluencer Discovery
How you can See Past "Fake Influence"
February 9, 2017
As Influencer Marketing grows in popularity with brands, the demand for identifying influencers has also grown exponentially. With top influencers earning large pay cheques either directly from...
Influencer ListsEnergyEnvironment
Climate Action: Top 100 Influencers and Brands
February 7, 2017
The Defining issue of our age
Climate change is the defining issue of our age. The rise in the average temperature of the Earth's climate system and its related effects is no longer a prediction....

Influencer ListsB2CEvents
CES 2017: Top 100 Influencers and Brands
January 26, 2017
The Consumer Electronics Show (CES) was back in Las Vegas to celebrate its 50th edition surrounded by a new wave of gadgets to add to the Internet of Things library, drones, robots and even a smart...

Influencer ListsEnergyEnvironment
Cities4Climate: The Power of Influencer Engagement
January 26, 2017
As many are aware, momentum for climate action has recently shifted to a more local level. That’s why the team at Onalytica and I chose to zero in on the power and potential of Twitter influencer...

Influencer ListsB2C
The Brands eSports Influencers Have Been Talking About
January 26, 2017
In partnership with eSports Europe, taking place April 5-6 in London, we have been looking at the changing conversations of top eSports influencers over the course of 2015 and 2016. We wanted to...
Influencer ListsMarketing
MarTech: Top 100 Influencers and Brands
January 18, 2017
Martech is the blending of marketing and technology, with the aim of streamlining processes to achieve marketing goals and objectives. In this digital age, there is a huge demand for marketing...
Best PracticeMeasuring Success
5 Most Common Reasons why Influencer Marketing Fails
January 17, 2017
Let’s get straight to the point; brands recognize the huge opportunity within Influencer Marketing but not many brands feel that they are being successful at it. Especially with large enterprises...

Influencer ListsB2C
LOL World Championship: Top 100 Influencers and Brands
January 11, 2017
The 2016 League of Legends World Championship was a competitive gaming event held across several cities in the United States from September 29 – October 29, 2016. Sixteen teams qualified for the...
Best PracticeMarketing Stategy
5 Predictions for Influencer Marketing in 2017
December 29, 2016
It seems like five minutes ago we entered 2016, yet here we are within what feels like a blink of an eye getting ready to see off yet another year and sing our hearts out to Auld Lan Syne. However,...

Influencer Lists
Onalytica’s Top 10 Blogs of 2016
December 20, 2016
In 2016 we were busy as ever publishing lots of influencer lists on new and exciting topics. As the year draws to a close we thought we would look back and see which of our blogs resonated the most...

Influencer ListsTech
PropTech: Top 100 Influencers and Brands
December 15, 2016
PropTech - also described as as CREtech (Commercial Real Estate Technology) or REtech (Real Estate Technology), refers to new technologies specifically designed to improve processes and propel the...
Influencer ListsPublic Sector
GovTech: Top 100 Influencers and Brands
December 7, 2016
Regardless of your political leanings and whether you advocate for more or for less government, governments play a central role in organizing and delivering services that citizens cannot do on their...

Influencer ListsTech
Robotics: Top 100 Influencers and Brands
November 30, 2016
Robotics is the branch of science consisting of a diverse range of technologies including mechanical engineering, electrical engineering and computer science. Robotics covers the design,...

Best PracticeB2BMarketing Stategy
8 Tips for Your B2B Christmas Marketing
November 24, 2016
I know what you’re probably thinking: “Christmas? It’s not even December yet!”- but what use would these tips be if I were to share them on Christmas eve? Besides, November is disappearing...

Influencer ListsFinanceTech
InsurTech: Top 100 Influencers and Brands
November 23, 2016
Insurance technology, also known as InsurTech, is an economic industry composed of companies that use technology to make insurance services more efficient. InsurTech is an integral part of the...

Best PracticeMarketing Stategy
10 Reasons why we do Influencer Marketing
November 17, 2016
Influencer Marketing- something you've probably heard a lot about recently. Many think it's a no brainer and the best thing since sliced bread (in the social media world anyway), some see it as...

Influencer ListsTech
Future of Work: Top 100 Influencers and Brands
November 16, 2016
The workplace is evolving, disruptive innovations are causing new industries to emerge and business models and management practices to change. Advancements in technology and ways of communicating are...

Best PracticeInfluencer ActivationMarketing Stategy
How to Effectively Market to Millennials
November 10, 2016
Over the years, brands have shifted their approach from traditional generalised advertising to direct marketing- a practice which completely makes sense when you're aiming to appeal to an array of...

Influencer ListsTech
Connected Home: Top 100 Influencers and Brands
November 9, 2016
Connected home (also known as smart home, or home automation) involves the control and automation of lighting, heating, ventilation, air conditioning and security, as well as home appliances such...
Influencer ListsFinanceTech
Crowdfunding: Top 100 Influencers and Brands
November 2, 2016
Crowdfunding has become an essential way to fund innovative startups worldwide since the Financial Crisis. It has democratized the capital formation process by taking funding away from banks and...

Best PracticeInfluencer ActivationSEO
Improve Your SEO With Influencer Marketing
November 1, 2016
Going into 2017, improving your SEO should remain hot on your agenda, as without giving it consideration, finding your website may well be like trying to find a needle in a metaphorical, saturated...

Influencer ListsGamingTech
Augmented Reality: Top 100 Influencers and Brands
October 27, 2016
Augmented reality (AR) is a live direct or indirect view of a physical, real-world environment whose elements are augmented (or supplemented) by computer-generated sensory input such as sound, video,...

Best PracticeInfluencer ActivationMarketing Stategy
#ad – Lucrative for Celebrities, What About the Brands?
October 26, 2016
Whether you’re a social media addict compelled to share picturesque sunsets and Tumblr worthy salads, or you’re partial to the standard social media check during your daily commute, you’re...

Best PracticeEventsInfluencer Activation
Under The Influence, Oct '16- Quotes & Pictures
October 18, 2016
The days are getting shorter, darker and colder as we officially head into Autumn/Winter 2016. Whilst the season of sherry, songs and Santa is nigh, we felt that a wonderful evening full...
Influencer ListsCharityTech
Digital Inclusion and Accessibility: Top 100 Influencers and Brands
October 13, 2016
Whether you need to pay a household bill, find a job or maintain contact with your family and relatives, going online has become essential part of our every day lives. For many though, this is...
Influencer ListsTech
IT Service Management: Top 100 Influencers and Brands
October 5, 2016
IT service management describes a strategic approach for designing, planning, delivering, managing and improving the way IT is used within an organization. Some of the best examples of ITSM methods...
Influencer ListsMarketing
Social Media Marketing 2016: Top 100 Influencers and Brands
September 28, 2016
Social media marketing (SMM) is a form of digital marketing that utilises social networking sites as a marketing tool to gain traffic or brand attention. One of the main goals of SMM is to produce...
Influencer ListsTech
Unified Communications: Top 100 Influencers and Brands
September 14, 2016
Unified communications refers to the integration of communication tools that help people exchange ideas and do their jobs more effectively. It involves the integration of real-time, enterprise,...

Influencer ListsB2C
Sponsors at the Rio 2016 Olympics: Top 100 Influencers and Brands
September 7, 2016
The Olympics is a momentous event, historically uniting the world and evoking competitive streaks amongst even the most timid since 776 BC in Athens. Given that it only happens every 4 years, the...

Influencer ListsB2C
The British Automotive Industry: Top Influencers and Brands
August 31, 2016
The British automotive industry is best known for premium and sports cars including Aston Martin, Bentley, Caterham Cars, Daimler, Jaguar, Land Rover, Lotus, McLaren, MG, Mini, Morgan and...
Best PracticeMarketing Stategy
10 Answers to Common Influencer Marketing FAQs
August 24, 2016
Here are some of the most common questions we get asked about influencer marketing:
1. What is Influencer Marketing?
Influencer marketing is the practice of marketing to people who influence your...
Influencer ListsAnimal Welfare
Animal Welfare: Top 100 Influencers and Brands
August 17, 2016
There's no doubt that there has been a noticeable movement towards adopting a healthier diet, with many ditching the standard cornflakes and cow's milk, in favour of a bowl of Zoats made...

Influencer ListsTech
Data Security: Top 100 Influencers and Brands
August 10, 2016
The data security market is estimated to be worth in excess of $202 Billion by 2021, growing at an annual rate of 9.8%. The number of seven-figure deals alone has grown by 40% year-on-year...
Influencer ListsTech
M2M 2016: Top 100 Influencers and Brands
August 3, 2016
Machine to Machine (M2M) refers to direct communication between devices using any communications channel, including wired and wireless. The M2M market is undergoing a fast transformation as...
Influencer ListsFinanceTech
Blockchain: Top 100 Influencers and Brands
July 19, 2016
Blockchain is a data structure that makes it possible to create a digital ledger of transactions and share it among a distributed network of computers. Blockchain technology uses cryptography which...

Influencer ListsFinanceTech
Fintech 2016: Top 100 Influencers and Brands
July 13, 2016
Fintech is an economic industry composed of companies that use technology to make financial services more efficient. Fintech companies are generally startups trying to disintermediate incumbent...
Influencer ListsTech
Digital Transformation: Top 100 Influencers and Brands
July 6, 2016
Digital transformation is the term given to the transformation of business activities, processes and models to fully leverage the opportunities of new digital technologies. According to a...

Influencer ListsMarketing
Content Marketing 2016: Top 100 Influencers and Brands
June 29, 2016
The rise and rise of content marketing has turned traditional businesses into media publishing companies, using content to drive traffic, raise awareness, generate leads and boost sales. However with...

Influencer ListsHealth
Mental Health: Top 100 Influencers and Brands
June 16, 2016
Mental health is the successful performance of mental function, resulting in productive activities, fulfilling relationships with other people, and providing the ability to adapt to change and cope...
Influencer ListsEnergyEnvironment
Renewable Energy: Top 100 Influencers and Brands
June 2, 2016
Renewable energy is energy collected from resources which are naturally replenishable, such as sunlight, wind, rain, tides, waves, and geothermal heat. Governments around the world are investing...

Influencer ListsEducation
Edtech and Elearning 2016: Top 200 Influencers and Brands
May 26, 2016
Education is the doorway to the future, and we have a shared goal to create a better future for our children by providing them with the best education now, so they will have the best opportunities...

Best PracticeInfluencer ActivationInfluencer DiscoveryMarketing StategyMeasuring Success
How to Integrate Influencer Marketing Into Your Marketing mix
May 18, 2016
A presentation by Tim Williams, CEO of Onalytica on how to integrate influencer marketing into your marketing mix, including the business case for influencer marketing, engagement models and how to...

Best PracticeInfluencer ActivationInfluencer DiscoveryMarketing Stategy
Influencer Marketing: The Better Practice Guide
May 18, 2016
Purchasing decisions are more often influenced by expert or thought leader recommendations than traditional advertising. As a direct result of this many organizations are now placing influencers in...

Influencer ListsGamingTech
Virtual Reality 2016: Top 100 Influencers and Brands
May 12, 2016
Virtual reality is a computer-generated, immersive reality that provides a user with an artificial sensory experience. Virtual reality can help replicate an environment through the use of specific...

Influencer ListsHealthTech
Digital Health 2016: Top 100 Influencers and Brands
May 6, 2016
Digital Health is the convergence of the digital and genetics revolutions within medicine and health. The goal of digital health is to ultimately improve the quality of our healthcare and our daily...

Influencer ListsB2C
The London Games Festival: Top 100 Influencers and Brands
April 29, 2016
The London Games Festival took place from 1st - 10th April 2016 and featured an exciting new celebration of the art, culture and business of video games. The festival included 15 official events...
Influencer ListsMarketing
Digital Marketing 2016: Top 100 Influencers and Brands
April 20, 2016
The internet has drastically changed how consumers behave and how businesses market their products and services. Traditional marketing models still apply, but marketers now need a whole new set of...

Influencer ListsEventsFinance
Innovate Finance Global Summit: Top 100 Influencers and Brands
April 18, 2016
The Innovate Finance Global Summit 2016 took place on 11th April 2016. #IFGS2016 championed and celebrated the latest developments in FinTech at the historical heart of financial services: London....
Influencer ListsEnvironmentEvents
World Water Day 2016 Influencers – Top Individuals and Brands
April 8, 2016
Each year on March 22, World Water Day is celebrated to bring international attention to the critical importance of water in our everyday lives. In the lead up to World Water Day 2016, we examined...

Influencer ListsTech
Cyber Security and InfoSec: Top 100 Influencers and Brands
April 6, 2016
Cyber Security and InfoSec remain critical concerns for brands and governments who need to safeguard their information against espionage attacks and criminal or negligent behaviour. Data breaches...

Influencer ListsB2C
Beauty Bloggers: Top 100 Influencers and Brands
March 23, 2016
No stranger are we to the conversation of 'beauty'; a huge topic and industry that is discussed online day in, day out. Where it used to be most common for high profile celebrities to be...

Influencer ListsEvents
MWC 2016: Top 100 Influencers and Brands
March 16, 2016
Mobile World Congress (MWC) 2016 took place in Barcelona from 27th Feb - 2nd March 2016. More than 2,200 companies attended, exhibiting their new products aimed at transforming our personal and...

Influencer ListsEnvironment
Water Security Influencers and Climate Change
March 15, 2016
At Onalytica we identified the key climate change influencers when we produced the Climate Change: Top 100 Influencers and Brands report in December 2015. Water security and climate change are...
Influencer ListsTech
Open Source: Top 100 Influencers and Brands
March 9, 2016
Open source is the practice of granting universal access to a product's design or blueprint, and allowing its redistribution, including subsequent improvements to it by anyone. Open source code is...
Influencer ListsEnvironmentEvents
World Water Day 2015 Influencers: Top 10 Individuals and Brands
March 4, 2016
In 2015, World Water Day was held on March 22, with the topic theme for the year Water and Sustainable Development. This year, World Water Day will be held again on March 22nd, with the event...
Influencer ListsTech
AI & Machine Learning: Top 100 Influencers and Brands
March 3, 2016
The term Artificial Intelligence was originally coined by John McCarthy in 1955, defining it as "the science and engineering of making intelligent machines". Now more than a half a century old,...

Influencer ListsEnvironment
Sustainability: Top 100 Influencers and Brands
March 2, 2016
There may be few other categories where the information shared and community built could be of more significance than around the topic of sustainability . The “stakeholders” for business include...

Influencer ListsMarketing
Social Selling 2016: Top 100 Influencers and Brands
February 24, 2016
Social selling is the process of developing relationships as part of the sales process, this mostly takes place on social networks such as LinkedIn, Twitter and Facebook but can also take place...

Influencer ListsEnvironment
Water Security Influencers: Top Individuals and Brands
February 22, 2016
Faced with a growing population and climate change, the UN has warned that by 2030 the demand for water is expected to exceed supply by about 40%, with half the global population facing water...
Influencer ListsTech
IoT 2016: Top 100 Influencers and Brands
February 17, 2016
The Internet of Things (IoT) is the term used to describe the networking of physical objects, such as consumer electronic devices, vehicles, buildings, air conditioners, heating systems and other...

Influencer ListsB2C
The Super Bowl 50: Top 100 Influencers and Brands
February 10, 2016
Sunday 7th February 2016 saw one of the biggest sporting events in the world take place, the Super Bowl, where the Denver Broncos took on the Carolina Panthers at the Levi's Stadium, in Santa...

Best PracticeInfluencer Activation
How Engaging With Influencers can Boost Your Content Marketing
February 9, 2016
If you think you moved a giant rock by developing your content, well now you have to move a mountain to market it. Brands create a lot of content and post it on their owned media channels, be it...

Influencer ListsB2C
The Super Bowl: Top 50 UK Influencers
February 5, 2016
This Sunday 7th February 2016 sees one of the biggest sporting events in the world take place, the Super Bowl. The Denver Broncos will take on the Carolina Panthers at the Levi's Stadium, in Santa...
Influencer ListsTech
Big Data 2016: Top 100 Influencers and Brands
February 3, 2016
The Big Data technology and services market is one of the fastest growing, multi-billion dollar industries in the world. This market is expected to grow at a 26.4% compound annual growth rate to...
Influencer ListsHealth
Tackling Obesity: Top 100 Influencers and Brands
January 27, 2016
Obesity worldwide has more than doubled since 1980. The fundamental cause of obesity is an energy imbalance between calories consumed and calories expended. Globally, there has been an increased...

Influencer ListsTech
Cloud: Top 100 Influencers and Brands for 2016
January 20, 2016
Cloud storage is the solution to the ever increasing demand for accessing data anywhere, from any device. In 2015 we uncovered the top 100 cloud influencers and brands in our blog, and we were keen...

Influencer ListsB2CEvents
CES 2016: Top 100 Influencers and Brands
January 13, 2016
CES 2016, the annual Consumer Electronics Show in Las Vegas, took place from the 6th-9th January. All the big tech brands, and a lot of new tech startups as well, were there to showcase the best...

Best PracticeEmployee AdvocacyInfluencer ActivationInfluencer DiscoveryMarketing Stategy
5 Predictions for Influencer Marketing in 2016
January 6, 2016
Influencer marketing now makes up a significant part of marketing budgets and according to a report by Tomson, 59% of marketers have plans to increase their influencer marketing budget in...

Influencer ListsHealth
Health and Fitness: Top 100 Influencers and Brands
December 23, 2015
Health and fitness bloggers took social media by storm in 2015, writing about fitness plans, workout routines, alternative diets and of course the increasingly popular phenomenon of avocado on toast!...
Best PracticeTech
Our Experience Using Vivify Scrum at Onalytica
December 21, 2015
Here at Onalytica, we've been on something of a journey with our development management tools. We develop to the principles of agile development — specifically Scrum. We use to find engaging with...
Influencer ListsEnvironment
Climate Change: Top 100 Influencers and Brands
December 9, 2015
The 21st United Nations Climate Change Conference, Cop21, is being held in Le Bourget, Paris from 30th November - 11th December 2015. The main objective of the conference is to achieve a legally...
Influencer ListsFinance
Fintech 2015: Top 100 Influencers and Brands
December 2, 2015
Traditional banking is being challenged as Fintech entrepreneurs and start-ups take matters into their own hands. This emerging market has seen a burst of activity over the last 5 years, global...

Influencer ListsFinance
B2B Marketing: Top US and UK Influencers and Brands
November 25, 2015
We analysed the B2B marketing discussion last year and earlier this year, and we wanted to continue with these reports to show how influencer trends map out over time. It's intriguing to see new...

Influencer ListsB2C
Key Insights from 100 Influencers in the UK Mum Community
November 18, 2015
Mums are fast becoming a powerful economic force in the economy, and a very influential community. "Mumpreneurs" generated £7B in the UK and supported 204,000 jobs last year. Many of these mums are...
Influencer ListsB2C
Call of Duty Black Ops III: Top 100 Influencers and Brands
November 11, 2015
Call of Duty Black Ops III is a military science fiction first-person shooter video game, developed by Treyarch and published by Activision. It is the twelfth game in the Call of Duty franchise, and...

Influencer ListsB2C
Rugby World Cup 2015: Top 100 Influencers and Brands
November 4, 2015
The Rugby World Cup 2015 ran for six weeks from 18th September until the 31st October 2015 and produced some of the most exciting matches the tournament has ever seen. Japan dazzled the crowds as...
Influencer ListsHealth
GMO vs. Organic Food: Top 100 Influencers and Brands
October 28, 2015
GMO stands for “genetically modified organism” and uses biotechnology to alter plant DNA, making certain crops resistant to pesticides and other chemicals so that farmers can more easily protect...
Influencer ListsEnvironment
Gatwick vs. Heathrow: Top 100 Influencers and Brands
October 21, 2015
The Gatwick vs. Heathrow debate began in September 2012 when the Airports Commission was established by the Department of Transport, with a mandate to set out how the United Kingdom could:...

Best PracticeInfluencer ActivationInfluencer DiscoveryMarketing Stategy
Infographic: Influencer Marketing Survey
October 15, 2015
This October 2015 survey highlights findings from Onalytica’s focus groups and consultations with 100 Marketing Directors, Heads of Social Media, Communication & PR Professionals. Discussions...

Influencer ListsHealth
Cancer Care: Top 100 Influencers and Brands
September 17, 2015
There are thousands of charities and campaigns around the world focused on the prevention and extinction of the dreaded ‘C’ word. Each of these organisations has a slightly different demographic,...
Influencer ListsMarketing
Social Media Marketing: Top 100 Influencers and Brands
September 16, 2015
There was once a day when the only way to communicate was to write a real letter, physically talk to a person or dial a telephone. When you got on the bus in the morning, commuters were catching up...
Influencer ListsFinance
Fintech: Top 100 Influencers and Brands
September 9, 2015
From spending, saving and investing money, tools enabling us to manage our finances are more innovative than ever before. As accounts are increasingly being accessed on mobile devices, we find...

Influencer ListsTech
Telecoms: Top 100 Influencers and Brands
September 3, 2015
Communications technology and the telecoms industry have evolved dramatically over the past 10 years, due to growth in the mobile phone industry and advancement in internet communications. The...

Influencer ListsEducation
Edtech and Elearning: Top 100 Influencers and Brands
August 26, 2015
September is approaching, the #BackToSchool promotions are in full swing, students are getting their exam results and thinking about higher education. This is also the time teachers and lecturers...
Influencer ListsMarketing
Growth Hacking: Top 100 Influencers & Brands
August 12, 2015
If you're a marketer (or you work in a startup) chances are you have heard of the term"growth hacking".
Sean Ellis coined the term "growth hacking" in 2010 and in a few years it has become extremely...
Influencer ListsTech
Top 100 Cloud Influencers and Brands in 2015
July 29, 2015
We are creating more and more content than ever before on our computers, notebooks, tablets and smart phones. 90% of the world’s content was generated in the last two years alone! From documents,...
Influencer ListsMarketing
B2B Marketing: Top 100 Twitter Influencers
July 15, 2015
70% of B2B marketers are creating more content than they did one year ago
This data comes from the 2015 B2B Content Marketing Trends report from the Content Marketing Institute and...
Influencer ListsMarketing
PR 2015: Top 100 Influencers & Brands
July 8, 2015
Public relations is not what it used to be. The way technology evolved has forced this discipline to change like it has never changed before.
We live in a connected, mobile first world which...
Influencer ListsMarketing
Content Marketing 2015: Top 100 Influencers & Brands
June 30, 2015
What's next for content marketing?
With a growing discussion and a solid increase in the use of content marketing across all disciplines we are asking ourselves what's next for content...

Influencer ListsB2C
Music Industry: Top 100 Brands
June 17, 2015
The Music Industry is evolving and 2015 has seen some big developments. We now have the biggest companies in the world fighting it out to offer us the best on-demand streaming services, with access...

Influencer ListsTech
Cybersecurity 2015: Top 100 Influencers and Brands
May 20, 2015
Cybersecurity: Top 100 Influencers and Brands
Disclaimer: As ever with these lists, it must be stressed that the ranking below is by no means a definitive measurement of influence, as there is no...

Influencer ListsHealth
A&E Crisis: Impact of Social Media & Digital Influencers
April 23, 2015
Hanover and Onalytica were interested to analyse the interactions between influencers and online media when it came to the health policy debate.
The A&E “crisis” at the start of January 2015...
Best PracticeInfluencer ActivationInfluencer DiscoveryMarketing StategyMeasuring Success
How we Grew our Web Traffic by +400% With Influencer Marketing
April 15, 2015
Here's the story of how we grew our website from 2,000 to 10,000 unique visitors/month in one year. We also doubled our amount of sales enquiries over the same period. Read on to find out how we did...
Influencer ListsTech
The Internet of Things 2015: Top 100 Individuals and Brands
April 1, 2015
Modern devices are getting smarter, there are already fridges that order milk and other products when you're running low, soda streams that allow you to mix your drinks remotely via an...

Influencer ListsHealth
Digital Health Landscape 2015: Top 100 Influencers & Brands
March 18, 2015
Digital Health is the convergence of the digital and genetics revolutions within medicine and health. The goal of digital health is to ultimately improve the quality of our healthcare and our daily...

Best PracticeInfluencer ActivationSEO
How Influencer Marketing Can Improve Your SEO
February 12, 2015
There are lots of ways to drive quality traffic to your website in 2015. Although the amount of channels has clearly increased in the last few years, your best bet in driving traffic is still organic...

Influencer ListsMarketing
Social Selling 2015: Top 100 Influencers & Brands
January 28, 2015
Why should we care about social selling? Isn't it just another one of those buzzwords used to describe something we already know about? Isn't it just sales under a different name? If that's true...
Influencer ListsTech
Big Data 2015: Top 100 Influencers and Brands
January 21, 2015
Big data has received a lot of attention in the past couple of years from major companies as well as online communities. This is not surprising as there are claims (and proof) that big data can solve...

Influencer ListsB2CEvents
CES 2015: Top 100 Influencers and Brands
January 8, 2015
The annual Consumer Electronics Show in Las Vegas always whips up a frenzy among tech enthusiasts with reporters hammering away to bring us news of the hottest new products from the biggest tech show...
Influencer ListsTech
Wearable Tech Landscape 2015: Top Influencers and Brands
December 18, 2014
Wearable Tech made a big impact in 2014 and is set to keep rising in 2015 and beyond with a whole new wave of fashionable products including activity trackers, smart watches, glasses, VR...
Influencer ListsTech
Machine to Machine: Top 100 Influencers and Brands
December 10, 2014
Now we have the ability to control our heating remotely via an app, or tell our iKettle to start boiling water over wi-fi, it seems there’s no end in sight for the potential connectivity between...
Influencer ListsMarketing
Content Marketing Landscape 2014 – Top 200 Brands and Influencers
November 11, 2014
We're back with content marketing! After our initial post on content marketing influencers in last March, we are back with an updated list with even more thought leaders, network maps and insights....
Influencer ListsEventsMarketing
CMWorld 2014: Top 100 Most Influential Marketers
September 22, 2014
It's that time of the year again where +2500 marketers rush to Cleveland, Ohio to participate in the biggest content marketing event in the world. This year's event was huge and included keynotes...

Influencer ListsEventsMarketing
IFA 2014: Top Brands, Products and Influencers
September 16, 2014
With IFA2014 coming to an end last week, it’s been an extremely exciting time for all things consumer tech. IFA is the biggest consumer electronics event in Europe and took place in Berlin from the...
Best PracticeInfluencer DiscoveryMarketing Stategy
Influencer Marketing: go Global or Stay Local?
August 14, 2014
Globalization and social media have changed the way influencer marketing operates on a global and local level. Although every influencer typically has more influence in their local region it is now...

Best PracticeInfluencer Discovery
Two Methods to Find the Perfect Influencers
July 30, 2014
Engaging influencers in digital channels is no longer a new idea. Influencer marketing is rapidly becoming part of the mix as both consumer and B2B brands seek to grow their reach and establish...
Influencer ListsMarketing
B2B Marketing: Top 200 Brands and Influencers
June 16, 2014
B2B marketing is an expanding discussion, there are more commentators and online interaction than ever before and it is becoming tough to blast through the noise with top quality...
Best PracticeInfluencer ActivationSEO
Why Influencers are Essential to Content Marketing Success
June 11, 2014
All marketers face the same problems every day, figuring out ways to captivate their audience with quality content. The concept that content is king is well known to all, but the real problem that...

Influencer Lists
BYOD: Freedom or Fright? Top 100 Influencers
April 30, 2014
Are you looking for freedom and flexibility? Bring Your Own Device (BYOD) is a way that firms can empower employees to choose their own tools to get their work done. IT departments now often struggle...
Influencer ListsTech
The Internet of Things 2014 – Top 100 Organizations
April 17, 2014
Earlier this week we looked at the top 100 thought leaders within the Internet of Things (IoT) conversation on Twitter. Congratulations again to all of those who made the list (as well as those that...

Influencer ListsTech
The Internet of Things 2014 – Top 100 Thought Leaders
April 15, 2014
The digital universe continues to expand, doubling in size every two years according to a recent report from IDC and EMC. The Internet of Things (IoT) is seen as a key driver of this expansion, with...

Influencer ListsEvents
#Interop Las Vegas 2014 – Top Influencers & Brands
April 8, 2014
Last week we looked at the top 25 #Interop influencers after day 2 of the event, and we promised to do a full influencer analysis of the whole event. Well, that time has come - so, true to our word,...
Influencer ListsMarketing
The Top 100 #ContentMarketing Thought Leaders
March 26, 2014
From content shock to content schlock, content marketing has come under increasing scrutiny in 2014, as the market oscillates between banal "me-too" tips and reactionary treatises against content...

Influencer ListsEvents
MWC 2014 – Brand, Product & Influencer Analysis [INFOGRAPHIC]
March 5, 2014
Last week we took a quick look at the top influencers at MWC 2014 based around analysis of the #MWC14 hashtag. Now that the event is over and everybody has gone home (I presume), we ran some more...

Influencer ListsEvents
Mobile World Congress 2014 – Top Influencers (So Far)
February 26, 2014
It's Day 3 of Mobile World Congress (MWC) 2014 in Barcelona, with the mobile industry's flagship annual event having seen a number of major announcements already.
Highlights amongst others include...
Influencer ListsMarketing
Top ERP Thought Leaders
February 20, 2014
Enterprise Resource Planning (ERP) systems are used by large organizations to integrate business processes across various departments, and optimize their workflow. However, recent research from...
Influencer ListsTech
Big Data and CX – Most Influential Organizations
February 11, 2014
Last week, we published a list of the top individual thought leaders in and around the Big Data and Customer Experience conversation. Using our analysis platform, we analyzed the conversations and...
Influencer ListsTech
Big Data and Customer Experience – Top 100 Influencers
February 5, 2014
We've identified influencers within the Big Data space before (PS - for the most up-to-date rankings you can see our Big Data influencers list over on List.ly). It is indeed a big and - dare I say it...
Influencer ListsTech
Onalytica Big Data Influencers – Q4 '13
November 13, 2013
The latest Onalytica ranking of Big Data influencers on Twitter is now available. The top 200 influencers are listed below.
Methodology: We took the tweets for the last 6 months containing the...
Influencer ListsMarketing
Top 50 Influencers on Content Marketing
November 6, 2013
We carried out some analysis to bring you a list of the top 50 influencers on content marketing.
The list is generated by taking most (if not all) of the tweets from the last 4 months containing the...

Influencer ListsEducation
Top 101-200 Influential Education Blogs: Sep 2013
September 30, 2013
Here is the updated list of the top 101 - 200 influential education blogs.
You can see the top 100 here.
Top 101-200 Influential Education Blogs - Sep 2013
Change In...

Influencer ListsEvents
IFA 2013 – Top 100 Influencers
September 18, 2013
The IFA 2013 consumer electronics show in Berlin has been and gone for this year, with brands from around the world launching a host of new products, from innovative Smartwatches through to Ultra HD...

Best PracticeEventsInfluencer Activation
How to Use Influencers to Attract More Delegates to Your Events
September 16, 2013
Here is how you use Onalytica IRM to attract more delegates to your events.
1/ Upload your event content such as descriptions, session tracks, brochures and speaker profiles to Onalytica IRM along...
Best PracticeInfluencer ActivationInfluencer DiscoveryMeasuring Success
How to Run a Successful Influencer Marketing Program
September 13, 2013
The influencer marketing marketplace is relatively nascent and fragmented, with many different approaches to the same challenges and opportunities. At Onalytica we have run over 200 influencer...
Influencer ListsTech
Big Data Top 200 Influencers 2013
July 31, 2013
Big Data is a hot topic, if you are a vendor in the Big Data market place you are probably either already running influencer programs or strongly considering it.
The Big Data market place is quite...
Best PracticeInfluencer Discovery
Influencer Identification – The Good, the Bad and the Ugly
July 10, 2013
Influencer programs, influencer marketing, influencer outreach… with influencers increasingly providing the gateway to consumers and decision makers, more and more marketing and communications...

Influencer ListsEducation
Top 101-200 Influential Education Blogs
June 24, 2013
Further to our ranking of education blogs published last week, here is the list of the top 101 to 200 most influential education blogs, ordered by their Onalytica Influence...

Influencer Lists
What has changed in the Top 100 Influential Education Blogs ranking?
June 18, 2013
In a previous post we published a list of the top 100 most influential education blogs, ranked by their Onalytica Influence Index. Six months on, we have made an updated list of the top influential...

Best PracticeB2BMarketing Stategy
How to Make Your B2B Marketing Budget Work a Lot Harder
June 10, 2013
Have you ever walked into a mall to get a coffee and walked out with new garment or another item you had no idea you were going to buy when you walked in?
What often happens is that you browse with...

Best PracticeNews
Onalytica Named "Cool Vendor 2013" by Gartner
May 2, 2013
Onalytica has been named by Gartner as one of its Cool Vendors for 2013. We are one of just five companies to be featured within its Consumer Dynamics report, which recognises innovative consumer...
Best PracticeInfluencer ActivationMarketing Stategy
White Paper: Optimising Your Content Marketing Strategy
April 16, 2013
Content has become an essential currency for marketers. Though companies have been producing informative content such as white papers, case studies, webinars, research and videos for many years,...

Best PracticeInfluencer Activation
Getting Your Content to the Right Person at the Right Time
April 1, 2013
One of the hottest marketing tactics today is content marketing. According to the content marketing institute content marketing can be thought of as owning your own marketing channel rather than...
Best PracticeInfluencer ActivationInfluencer DiscoveryMarketing StategyMeasuring Success
How to Build an Influencer Program (That Gets Results)
March 6, 2013
When executed correctly, influencer marketing is an incredibly powerful way in which to spread your messaging across a wide range of networks, and reach your prospects with the information they need...
Influencer ListsFinance
Top 200 Most Influential Economics Blogs
November 26, 2012
Some time ago we listed the TOP 100 economics blogs, ordered according to their Onalytica Influence Index.
Similarly to how academic journals compute their Impact Factor, we determined the most...
LOAD MORE